LeanSentry now allows you to capture a crash dump for any application error that LeanSentry detects in your application.
While LeanSentry already provides exception details and stack trace information to help developers identify the source of an application error, this can sometimes be insufficient to determine WHY the exception is being thrown at that location.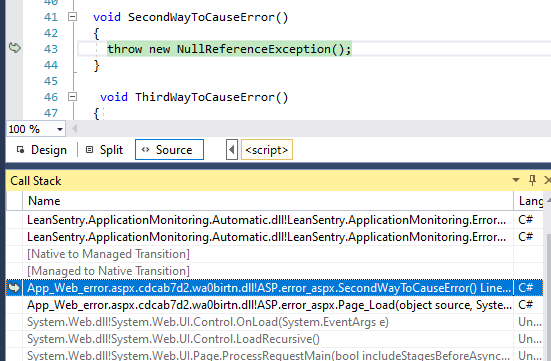
With this feature, a developer can download a crash dump and manually debug the application paused at the precise moment that the specific exception of interest was thrown.
How it works
You can request error debugging for any .NET exception tracked in your application through the LeanSentry Errors tab for a particular website. When you do this:
- The LeanSentry.ApplicationMonitoring library in your application then intercepts the specified exception when it is thrown, and requests the debugger to attach to your application at that moment.
- If this feature is enabled, and if this exception has not been diagnosed recently, LeanSentry will then attach a debugger and capture a crash dump of your application. This can typically only happen once a day to ensure minimal impact to your application.
- You can then locate the crash dump corresponding to that exception in the Crash diagnostics tab for your website, and download the crash dump for local debugging in Visual Studio or your favorite debugger.
NOTE: Unlike a normal crash, your application does not terminate/crash when an exception triggers this crash dump. The crash dump is captured, and your application then continues execution normally.
Prerequisites
In order to make this feature work, you need to have the following set up:
- Application running under .NET 4.0 or higher.
- LeanSentry Monitoring service version "2020-10-19_04_28_48" or higher and the LeanSentry Diagnostic agent version "2020-10-19_03_04_44" or higher. Contact support if you are not sure which versions you have installed.
- Add the LeanSentry.ApplicationMonitoring library in the target application, added as either LeanSentry.ApplicationMonitoring.Automatic.dll or LeanSentry.ApplicationMonitoring.Automatic.MVC.dll.
NOTE: This library must dated "10/18/2020" or higher to support this feature. - Make sure Windows Debuggers are installed on the server.
You can then enable this feature by requesting one or more application errors tracked in your application to be diagnosed, and enabling the Error Debugging feature in the Crash diagnostic settings (see below).
How to enable error debugging for an application exception
- Locate the error in the "Errors" tab for your website.
NOTE: This feature currently works with .NET application exception only. However, if you have LeanSentry.ApplicationMonitoring library added, LeanSentry will automatically link IIS errors like 500.0 with the underlying exceptions so you can see which application exceptions caused specific 500 errors.
If you are not seeing your error in the list, that means that LeanSentry is not currently tracking the error in your application likely due to your application handling/hiding the error. You can make sure that the error is tracked by LeanSentry. - Click the "settings" icon in the right-hand column to view the error settings, and check "Diagnose this exception" to request debugging for this error. Click "Save" to apply.
- By default, the error debugging feature is disabled globally. To enable the error debugging to take place, you must enable this feature for the entire environment or for a specific server.
You can enable it globally in the "Crash diagnostics" tab for any website.
WARNING: Enabling exception debugging for your entire environment could cause all your servers to perform exception debugging at the same time, causing some impact to your application. Out of abundance of caution, we currently recommend enabling this feature only for 1 or 2 specific servers out of your entire environment.
To enable this feature for a specific server only, go to the Environment settings, expand the settings for a specific server, and enable this feature in the "Crash diagnostics" tab.
How to find/download the error crash dump
Once the crash dump is captured, it will become available on the error details tab for the error and also on the "Crash diagnostics" tab for the website.
Get the exception dump from the error details (recommended)
To access the error dump:
- Click the error for which you have previously enabled error debugging,
- Open the "Debug this exception" tab,
- Expand one of the items in the list to download the exception dump.
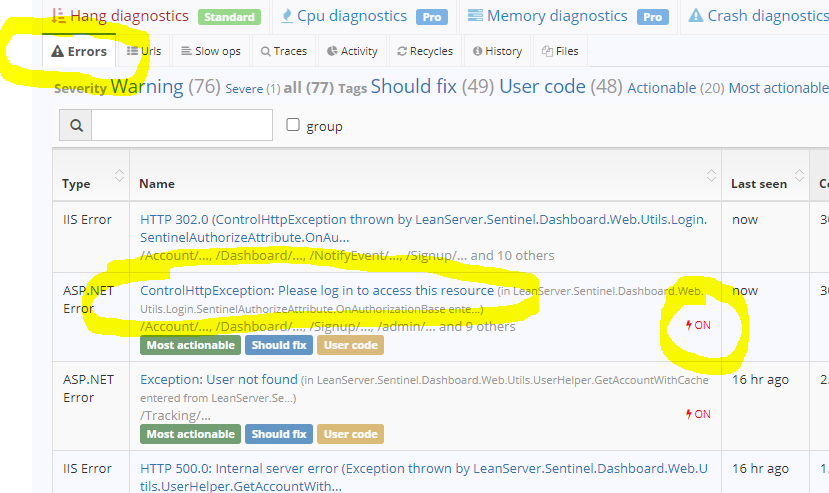
Use the "Debug this exception" tab to view the exceptions diagnosed in the current time period.
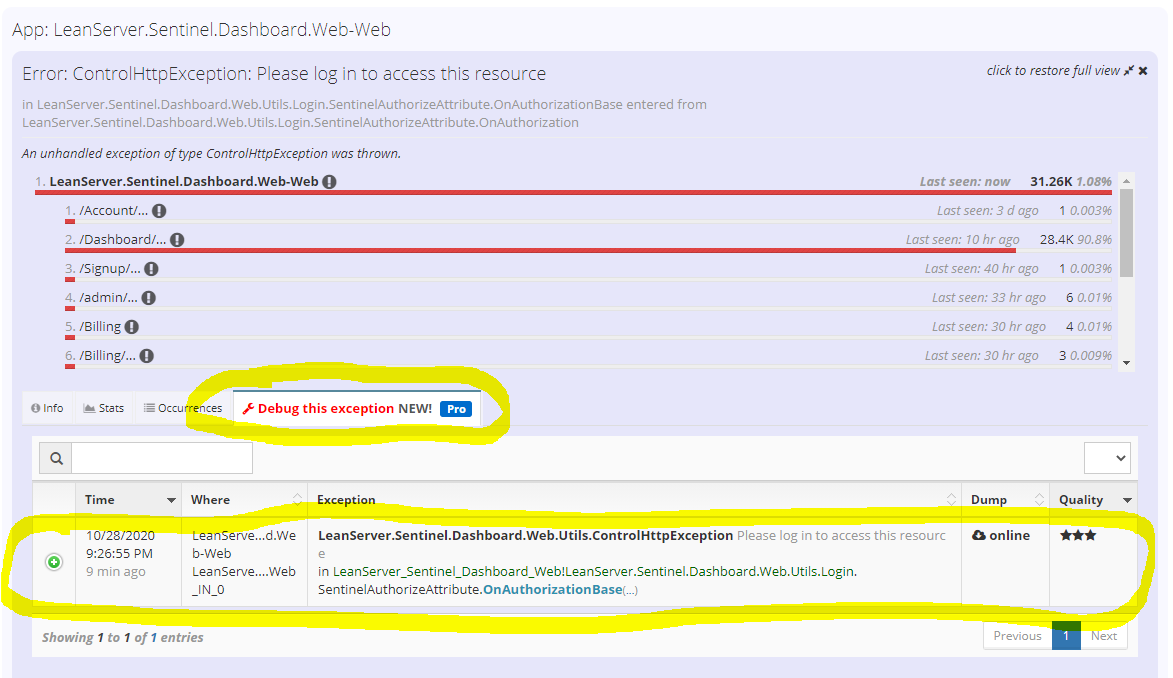
Expand each exception event to view the details and download the dump file: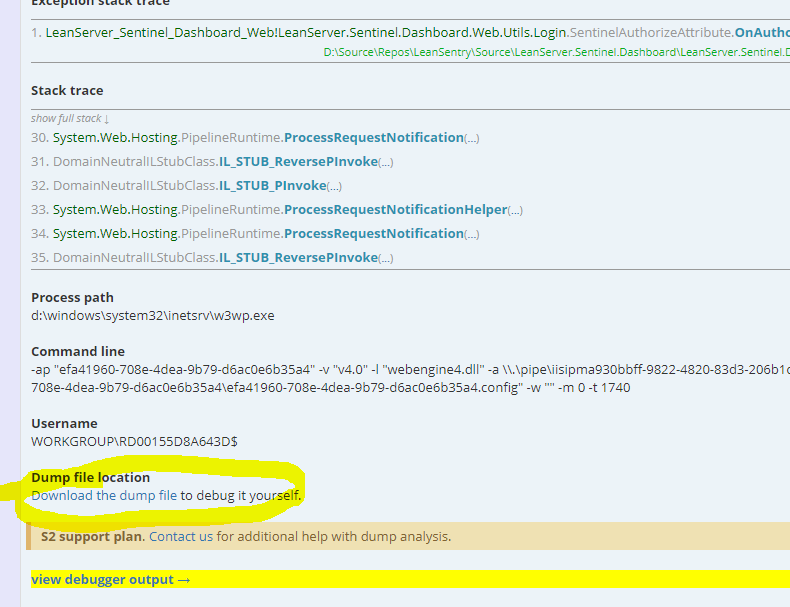
Get the exception dump from the Crash diagnostics tab
The Crash diagnostics tab will also list all error debugging events for all the exceptions that were debugged during the selected time period.
You can also filter to just the error debugging events for a specific exception:
Click the "diagnosed error" crash category or open the "reports" tab to find specific crash reports for your error.
Click the [+] button to view the details for the specific report and download the associated dump file.
FAQ
How do I open/debug the error dump file?
In order to take advantage of the dump file, you must be able to use Visual Studio or a Windows debugger like WinDbg to open the dump file and inspect the application state when the exception is thrown.
For example, to open the dump file in Visual Studio, click "Control-O" and navigate to the .dmp file. Then click "Debug with managed only" to begin debugging.
NOTE: You may need to browse to symbols and application source files when prompted to be able to debug your application.
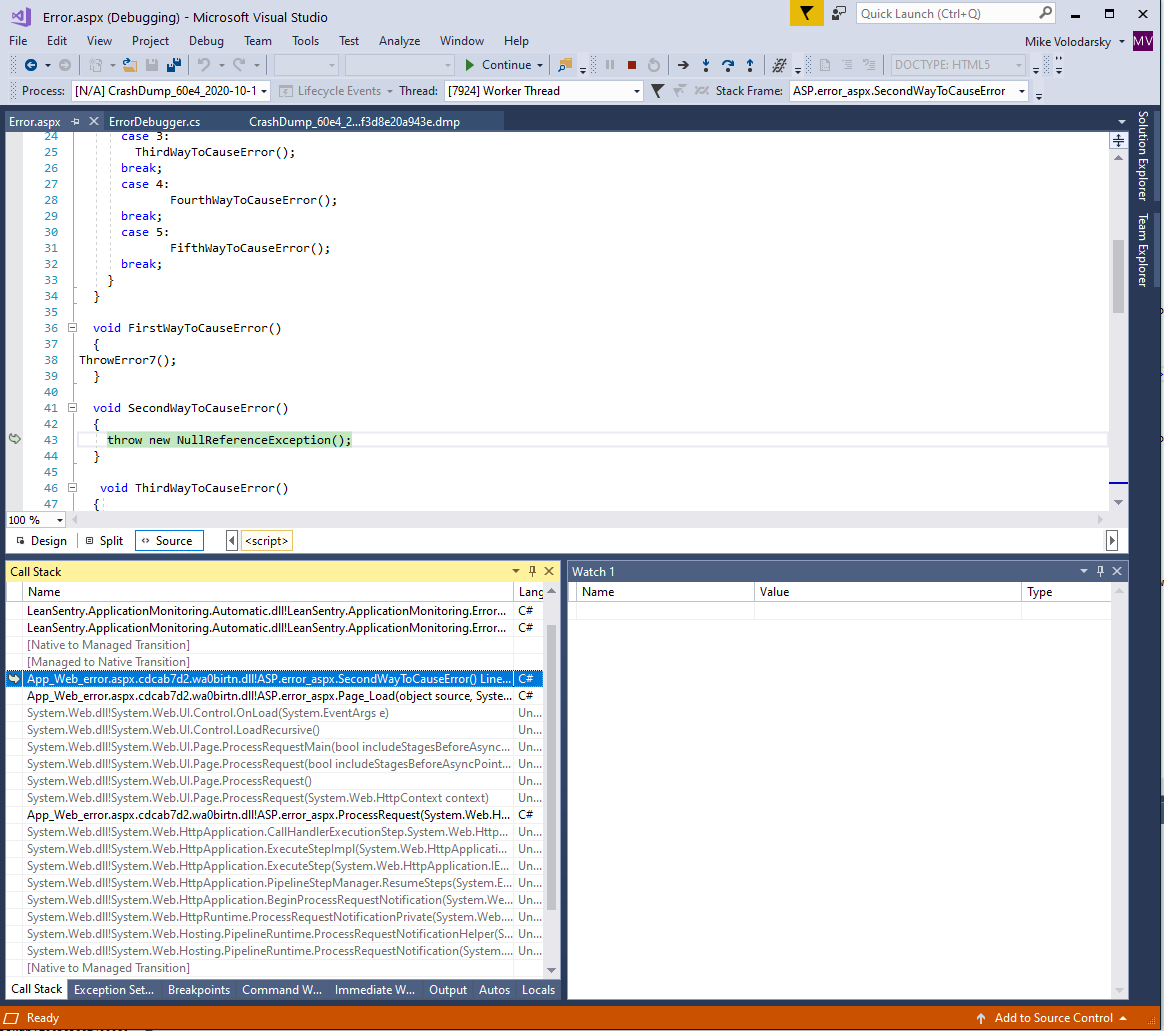
You can use the source window or the Watch window to inspect the state of the program around the exception to determine why it is being thrown.
I'd like to step through the program execution after the exception is thrown
The dump file represents a specific moment in time when the exception was thrown. You can expect the program state at that moment to determine why the exception was thrown. However, it is not possible to continue execution of your application with a dump.
I configured debugging for an error, but it's not generating a dump file
Please make sure that:
- All pre-requisites above are installed.
- Make sure you have a recent LeanSentry.ApplicationMonitoring library.
- You have enabled the error debugging feature in Crash diagnostic settings.
- The error has taken place in the application. If possible, try simulating the error in a test environment.
NOTE: Keep in mind that LeanSentry will not generate dump files for all occurrences of the error. It will typically limit dump collection to 1 occurrence of a specific error within a 24 hour period on each server where error debugging is enabled.
I made changes to my application, and want LeanSentry to generate another dump file if the error happens again
Because LeanSentry limits the dump capture to 1 per 24 hour period for each error on each server, you may not see another dump capture generated until the the next day.
If you would like to accelerate the dump capture, you can use the following workaround locally on each server where the application resides:
1. Locate and delete the exception .attempt file in the c:\leanserver\sentinelagent\temp\errors directory.
2. Restart the application.

Please use this workaround at your own risk however, as it may lead to LeanSentry capturing more dumps for your application than may be desired.
I want to take control over which exceptions are targeted for debugging
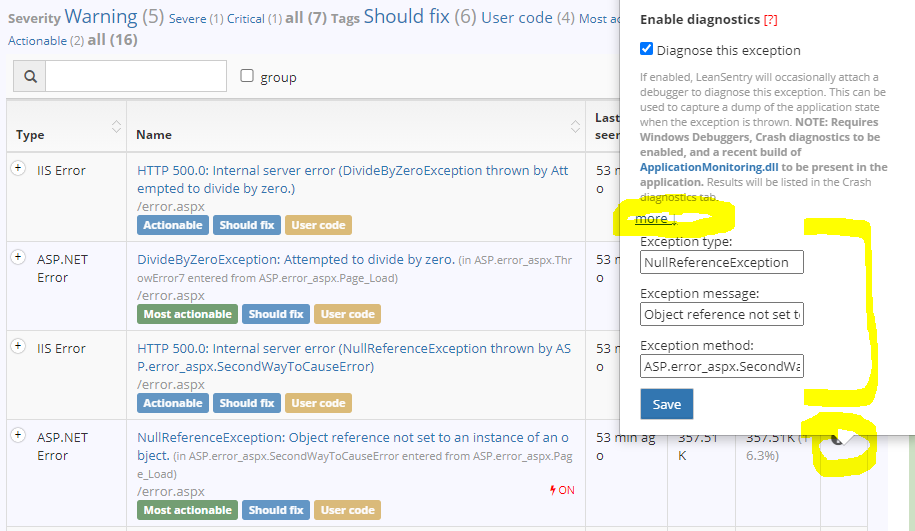
When you mark an error for debugging in the Errors tab, LeanSentry generates a default match criteria for the exception which includes the exception type, a method where it was last thrown, and a fragment of the exception message.
You can override this criteria manually to focus on a specific subset of exceptions.
To do this, locate the error in the Errors tab for a website, and then open the settings. Under the "Diagnose this exception" checkbox, click the "More" link, and modify the exception type, message, and exception method filters.
I am concerned about production impact of this feature
NOTE: This is a beta feature, and has received less testing and usage by LeanSentry customers than our regular diagnostic features.
The primary impact of this feature is the fact that your application may be paused for a brief time to capture a dump when the exception takes place. This time should be less than 10 seconds for most applications, but may be a minute or more for applications that use a lot of memory (10Gb+) and/or have slow disks.
The secondary impact may be the disk space, and CPU/disk overhead of writing the dump file to disk, and potentially uploading the dump file to our system.
The pause time and the system impact is directly proportional to the allocated memory size of your application at the time of dump capture.
That said, this action is limited to 1 time per exception per day on each server, so the impact should be limited to that single occurrence on each day on each server.
WARNING: If you are using LeanSentry to monitor all your servers, be aware that this feature could cause all your servers to trigger dump capture for an exception at roughly the same time, if the exceptions happen on all servers simultaneously. This can impact the availability of your application for the short time during which the dump is captured. To avoid this, enable Error debugging only on selected servers in the environment settings instead of enabling it globally for the entire environment.
Additional questions, feedback or issues
We look forward to hearing from you if you'd like share any feedback or ask any questions on this feature.

Comments
0 comments
Please sign in to leave a comment.