
LeanSentry monitors and diagnoses your applications out of the box, without the need to instrument them or load any third party dlls.
However, you CAN optionally enhance some aspects of LeanSentry monitoring by adding our LeanSentry.ApplicationMonitoring.dll plugin into your web application. These enhancements include:
- Automatically track more slow operations, including HTTP requests to remote services, MVC actions and views, and the ability to add custom application trackers.
- Enable several Performance score rules that proactively measure application scalability and thread performance.
- Link IIS 500 errors to underlying ASP.NET exceptions.
- Control how LeanSentry sees your traffic, including ignoring specific requests, and changing the logged client IP or changing the logged url.
Read the rest of this article to learn more about monitoring enhancements you can get by deploying the LeanSentry.ApplicationMonitoring.dll library to your application.
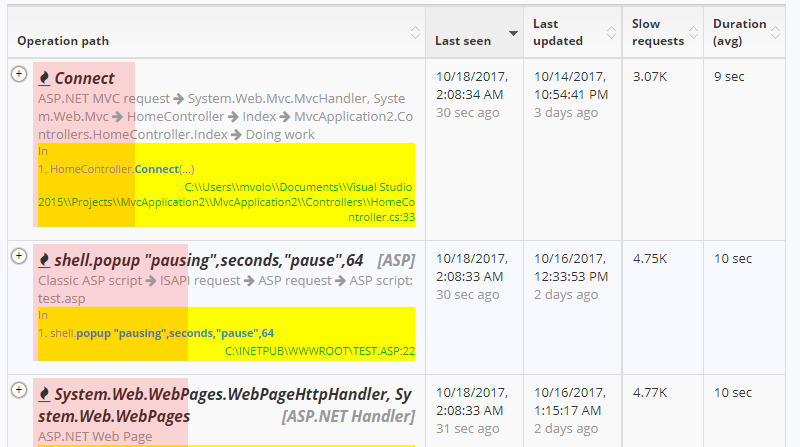
1. Track more slow operations
LeanSentry automatically tracks the operations causing your slow requests, but the default tracking is limited in resolution to the events traced by IIS and ASP.NET by default. By adding LeanSentry.ApplicationMonitoring.dll to your /BIN directory, we automatically trace:
- Remote HTTP calls made with HttpWebRequest (most REST and web service calls)
- Mvc controller actions
- Mvc views
You can also instrument your code further by referencing the LeanSentry.ApplicationMonitoring.dll library in your code and using the Tracker class.
2. Proactively analyze threading performance & scalability
LeanSentry's Proactive performance analysis feature helps your developers discover and fix application performance bottlenecks using best-practice performance analysis rules.
When you add LeanSentry.ApplicationMonitoring.dll to your application, it will publish a set of performance counters to enable these performance analysis rules:
- Thread pool performance. Tracks the ability of your application to provide threads for request and task processing.
- Thread workload scalability. Tracks how your application thread usage scales with the workload.

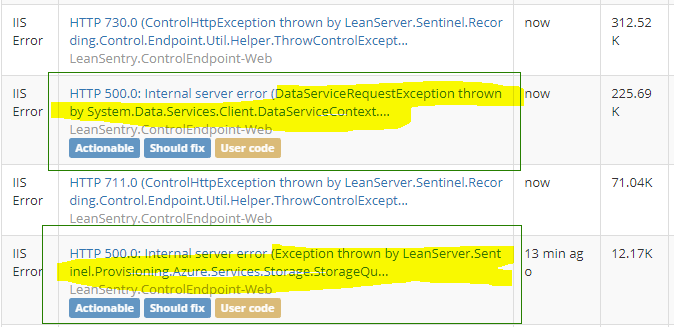
3. Improve error reporting
LeanSentry tracks errors across your entire application stack, including HTTP.SYS, IIS, ASP.NET, and your application.
However, it can be challenging to correlate the IIS errors (for example, HTTP 500.0) with the underlying application exceptions that triggered them.
When you deploy LeanSentry.ApplicationMonitoring.dll to your /BIN directory, we will automatically link the IIS errors logged by your website to the associated application exceptions:
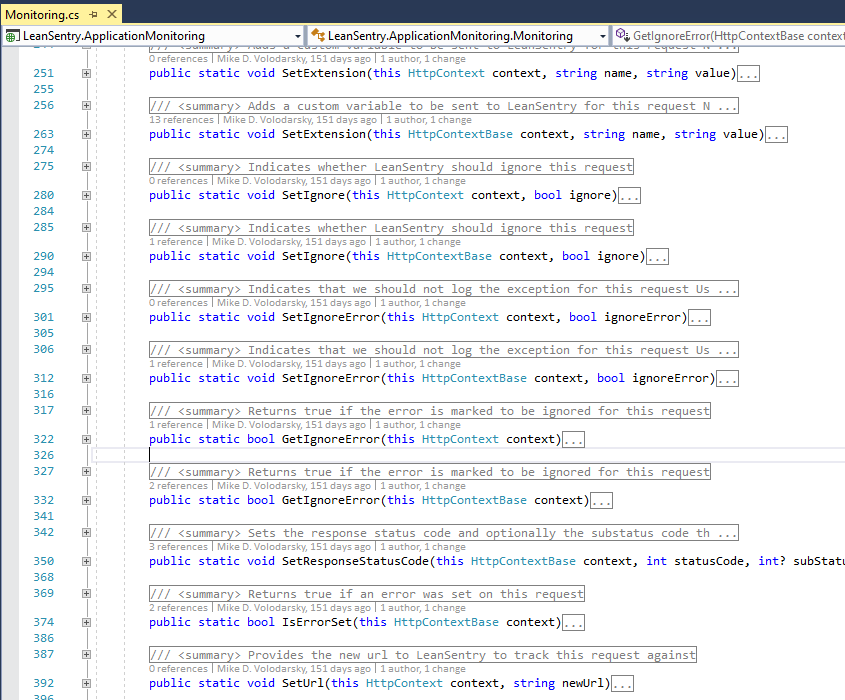
3. Control how LeanSentry sees your website traffic
By referencing LeanSentry.ApplicationMonitoring.dll in your application code, you can also control how LeanSentry sees the logged traffic to your application. You can:
- Change url of the request. This can be helpful if you want to combine multiple distinct urls into one virtual url for monitoring purposes, or if you want to modify how the request url appears in LeanSentry.
- Change the client IP address. LeanSentry.ApplicationMonitoring.dll will automatically replace the client IP with the X-Forwarded-For header if available, but you can also set the client IP manually if it is provided in a different way by your load balancer.
- Ignore requests. If you do not want to count the request in your statistics, you can set the request to be ignored by LeanSentry.
To perform these tasks, reference LeanSentry.ApplicationMonitoring.Monitoring class and use its SetUrl(), SetClientAddress(), and SetIgnore() methods.
Download and install LeanSentry.ApplicationMonitoring.dll in your application
Downloading the libraries
IMPORTANT:
- Please double-check that the libraries are digitally signed by LeanServer LLC before using them in your applications.
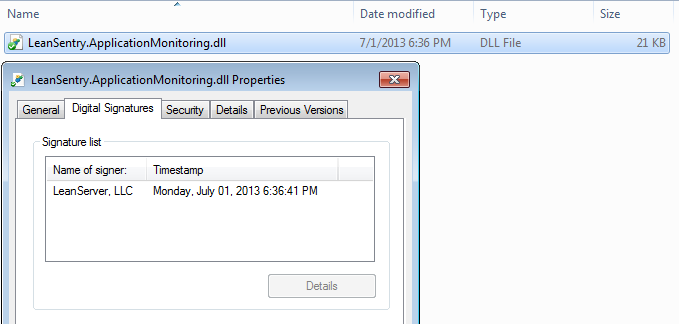
- Follow the instructions below to determine which libraries you will need.
- Test your application with the library first before deploying to production.
Download the libraries here >>
Deploying the library to your application
Because the libraries are configured to work in multiple environments, you may need to use a slightly different combination of libraries depending on your application.
Copy the appropriate DLLs to your application's /BIN directory. Use the table below to select the right configuration:
| APPLICATION VERSION | LIBRARIES TO USE |
|---|---|
.NET 2.0/3.5 (NO MVC) |
LeanSentry.ApplicationMonitoring.dll |
Additional configuration: Call Monitoring.Start() in global.asax: [C#] [VB.NET]
|
|
.NET 4.0+ (NO MVC) |
LeanSentry.ApplicationMonitoring.dll LeanSentry.ApplicationMonitoring.Automatic.dll |
Additional configuration: NONE, tracking is enabled automatically. |
|
.NET 4.0 + ASP.NET MVC 3.0+ |
LeanSentry.ApplicationMonitoring.dll LeanSentry.ApplicationMonitoring.Automatic.Mvc.dll |
|
Additional configuration: TIP: You specify your application's target MVC version in web.config in the newVersion attribute: <configuration>
<runtime>
<assemblyBinding xmlns="urn:schemas-microsoft-com:asm.v1">
<dependentAssembly>
<assemblyIdentity name="System.Web.Mvc" publicKeyToken="31bf3856ad364e35" />
<bindingRedirect oldVersion="0.0.0.0-6.0.0.0" newVersion="YOUR MVC VERSION" />
</dependentAssembly>
</assemblyBinding>
</runtime>
</configuration>
|
|
Frequently asked questions about the LeanSentry.ApplicationMonitoring.dll library.
1. How does LeanSentry track operations?
The operations are tracked from the lightweight ETW event trace generated for each request by IIS.
2. What is the performance impact of operation tracking?
The impact for most workloads is typically less than 1% CPU even if you have thousands of trackers per second, due to the high-performance nature of ETW tracing. The LeanSentry.ApplicationMonitoring.dll library was tested with workloads up to 5000RPS per server, with negligible performance overhead. This is significantly faster than most other application instrumentation libraries including System.Diagnostics or log4net.
Additionally, because LeanSentry.ApplicationMonitoring only traces operations you chose, it has SIGNIFICANTLY lower overhead then a profiler.
3. Where can I see custom information I log with the Tracker class?
You can see all traced operations, and all of their custom state, when viewing the detailed request trace for the request. You can find detailed request traces for slow or failed requests on the website's Performance page, the URL details page for a specific URL, or when viewing any of the tracked slow operation entries.
4. How do I debug tracing errors?
Startup exceptions
If the library encounters a problem, it WILL NOT prevent your application from starting by default.
Instead, it will log the error to the EventLog (it will be visible in the LeanSentry dashboard).
If you would like to debug any tracing issues, you can enable startup exceptions to be thrown by adding the following:
<configuration>
  <appSettings>
    <add key="LeanSentry.ApplicationMonitoring.ThrowStartError" value="true" />
  </appSettings>
</configuration>
WARNING: Enabling startup exceptions will cause any startup errors to break your application. DO NOT publish to production with this setting.
Tracing exceptions
You can also intercept any errors that take place during logging of individual trackers by listening on the LeanSentry.ApplicationMonitoring.Monitoring.Error event.
5. How can I turn tracing on/off programatically?
If you need to toggle tracing on/off from code, you can do so by setting LeanSentry.ApplicationMonitoring.Tracker.Enable.
// Turn off all tracking
LeanSentry.ApplicationMonitoring.Tracker.Enable = false;
// Turn tracking back on
LeanSentry.ApplicationMonitoring.Tracker.Enable = true;
6. Re-enabling the default trace listener
ApplicationMonitoring.dll removes the DefaultTraceListener by default, to improve performance. Most customers do not use the DefaultTraceListener. If you do need the DefaultTraceListener enabled, you can set the following app setting starting with the 7/26/2019 build of ApplicationMonitoring.dll:
<configuration>
  <appSettings>
    <add key="LeanSentry.ApplicationMonitoring.RemoveDefaultTraceListener" value="false" />
  </appSettings>
</configuration>
Comments
0 comments
Please sign in to leave a comment.