Introduction
Elevated CPU usage is a fairly common problem in production environments. Higher than normal CPU usage is often the primary cause of poor performance in the application. This happends when the CPU is overloaded and the application stops responding to the requests. Significant usage can also have a negative effect on all the applications hosted by this server.
There are several reasons for increased CPU usage by your application including garbage collection, hangs, high error rates or simply your application code that needs to be optimized.
How to identify elevated CPU usage in your application using LeanSentry
Select the application for which you wish to identify hangs.

Select the Cpu diagnostics tab.

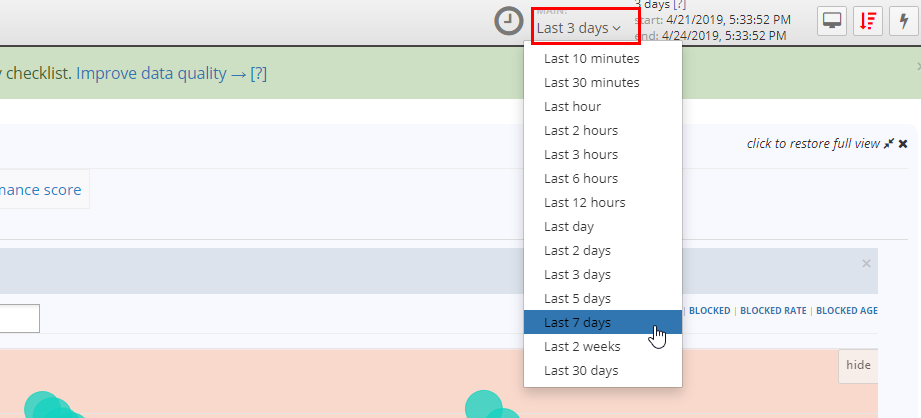
Then set the time frame.

Analyze the graph to see the CPU usage over time. You can easily identify if your application is using higher than normal CPU time using this graph. In our application, we are seeing several high CPU usage spikes.

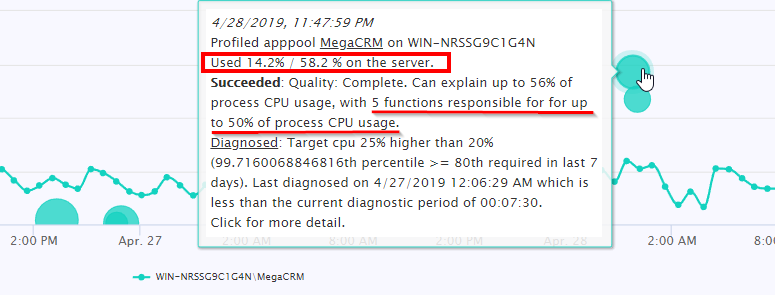
The bubbles indicate LeanSentry's attempt to diagnose the CPU usage each time LeanSentry identified a usage spike. Hovering over these bubbles provides a summary of the diagnostic report.

![]() A solid bubble indicates a successful diagnostic attempt.
A solid bubble indicates a successful diagnostic attempt.![]() A translucent bubble indicates that LeanSentry identified a CPU surge but was not able to diagnose it due to the current settings.
A translucent bubble indicates that LeanSentry identified a CPU surge but was not able to diagnose it due to the current settings.![]() A translucent bubble with a red border indicates a failed diagnostic attempt
A translucent bubble with a red border indicates a failed diagnostic attempt
There are two main visual indicators for elevated CPU usage caused by your application
1. The timeline graph shows spikes of elevated usage
2. We can see multiple diagnostic attempts by LeanSentry (represented by the bubbles)
Note: Sometimes the graph can take a while to load.
Filtering and opening CPU diagnostic reports
You can decide if a report could be of interest by looking at the CPU usage by the application/ server when the report was generated and the quality of the report. A short summary of the report is also provided. In order to find CPU reports that have the most useful information, we need to select the highest quality reports for moderate or higher CPU usage.
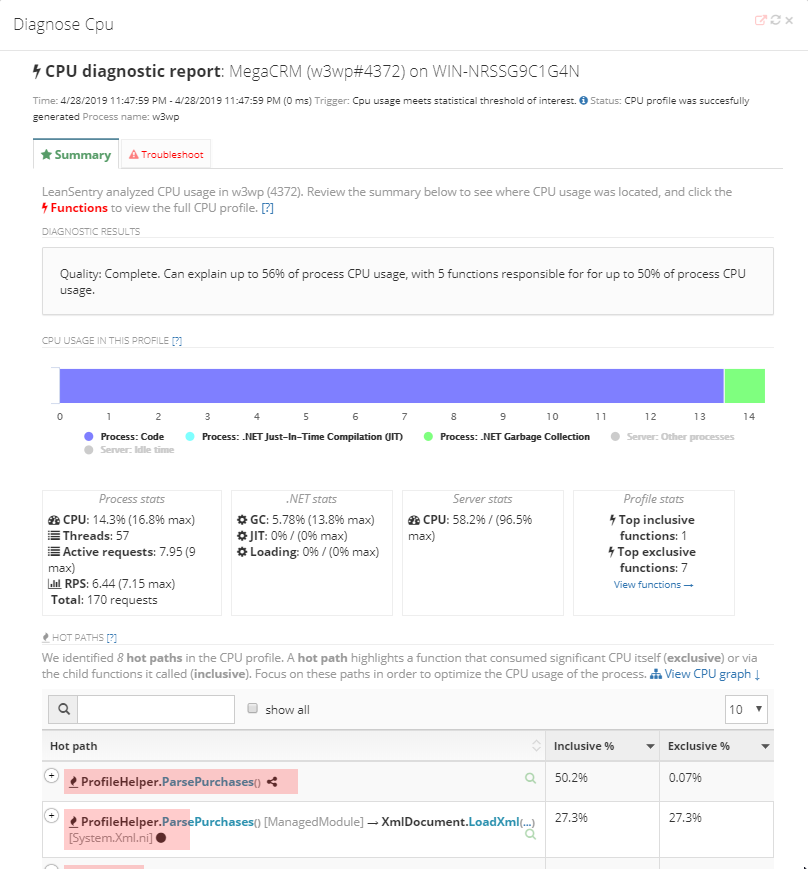
Opening a CPU report is fairly easy, simply choose the report you wish to explore and click open.
You can then use the report details to determine the cause of the elevated usage including the functions that were responsible for it.

Conclusion
Elevated CPU usage is difficult to recreate and can often slip past even after extensive testing. High usage is usually due to a particular function(s) using up the CPU time exclusively or by calling other functions which collectively increase the CPU usage. When a CPU surge is seen on your server, and LeanSentry has been deployed, LeanSentry will automatically diagnose it and provide reports highlighting the exact functions that were responsible for it.
Up Next: Interpreting a CPU report

Comments
0 comments
Please sign in to leave a comment.