
LeanSentry makes it easy to diagnose the root cause of memory leaks, excessive memory usage, and elevated .NET Garbage collection overhead. By identifying the root cause of these issues, they can be easily addressed at the root, eliminating poor performance and the need to excessively restart/recycle applications.
We also have a video showing how to trigger a memory diagnostic, in case you'd rather watch.
What do I need to be able to run a memory diagnostic?
All that is required to be able to run a memory diagnostic is the Windows Debugging Tools. Once they are installed on the server, you will then be able to run a memory diagnostic.
Because even the best third party profilers and debugging technologies often cause production problems, LeanSentry relies on the Windows Debugging Tools to perform safe production troubleshooting when a deeper analysis is needed.
We explain how to install the tools on your server here.
How can I trigger a memory diagnostic?
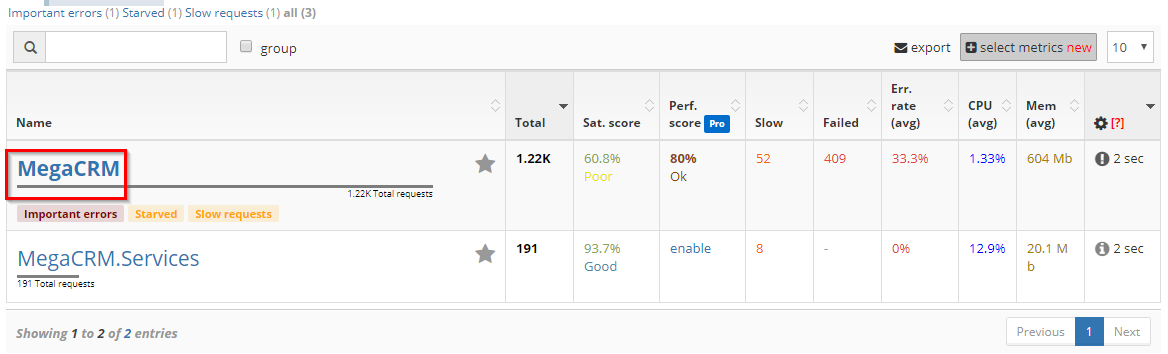
Select the application you want to diagnose memory in.
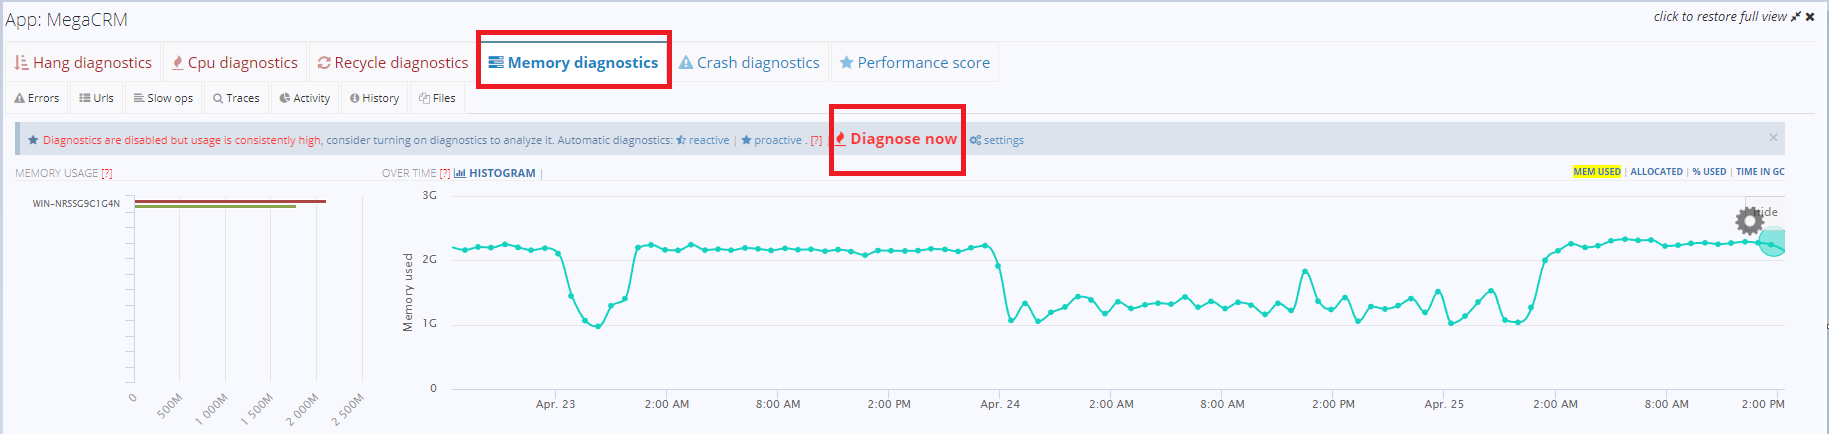
Navigate to the Memory diagnostics tab and select Diagnose now.
Here, we are given some options for running a diagnostic. Most importantly however, we are given two main diagnostic modes.
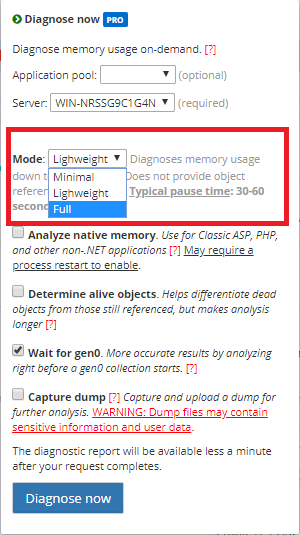
- Lightweight, which shows .NET objects holding onto memory, but not where they come from.
- Full, which shows .NET objects holding onto memory AND where they are being referenced from, which helps track down their source, making it easy to find a way to dereference those objects so that they can be garbage collected.
Once you have selected a mode, select Diagnose now and the diagnostic will start!
Note: we also show have a YouTube video on how to run a memory diagnostic here.
Is there a performance hit for running a diagnostic?
In a nutshell, memory diagnostics are our most intensive diagnostic. Depending on the memory size of the process, and referential complexity of the objects on the heap, the diagnostic could take anywhere between 20 sec to 5, or even 30 minutes worst case.
Because of this, we don't recommend automatic diagnostics for memory. Instead, we suggest
- Waiting for memory usage to grow to 60-75% usage
- The idea is to catch usage at higher levels than normal, but not necessarily at peak, because the same problem likely exists earlier. Doing it earlier reduces analysis time, and reduces chances of timeout.
- Trigger memory diagnostic manually from LeanSentry (Diagnose Now)
- Immediately remove the server from the load balancer to minimize time that the load balancer is sending new traffic to a paused process.
- Once completed, can return process to LB.
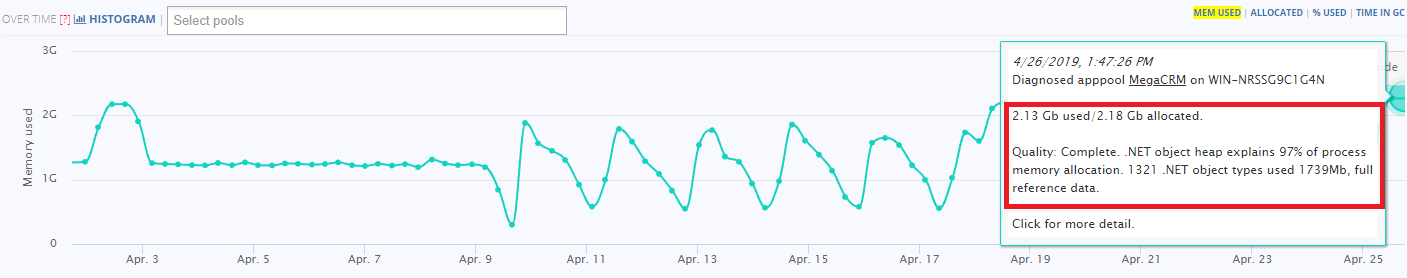
What does a diagnostic show?
Our diagnostics show:
- DLLs loaded into the process
- Native heaps (if native diagnostics are enabled)
- .NET memory: down to objects and where in the application code they are referenced from.
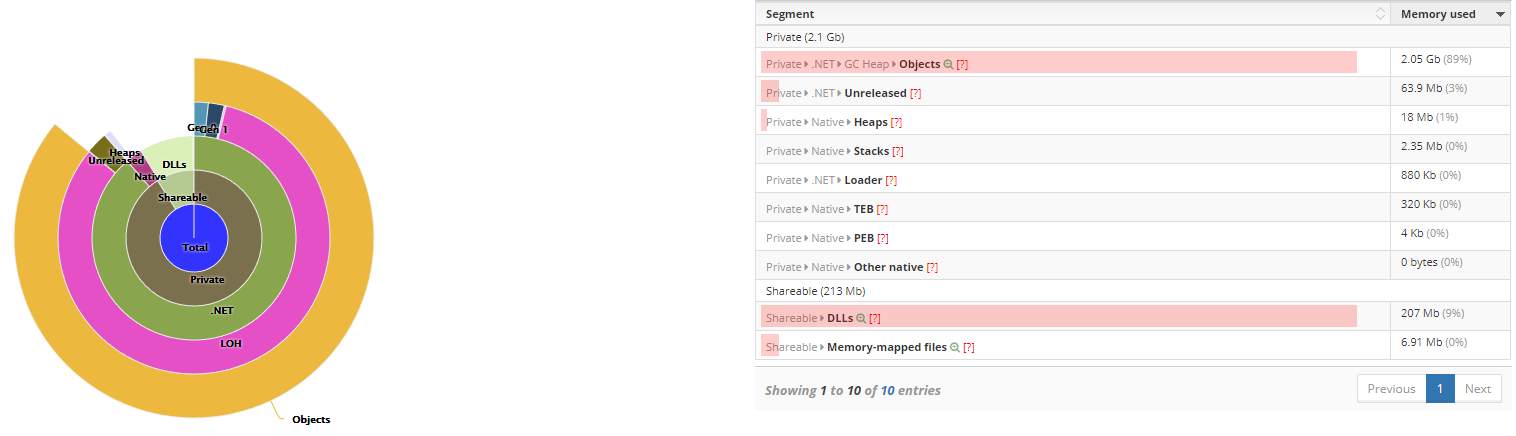
A developer can view the detailed memory layout report to rapidly optimize the application, reducing its memory usage and the associated Garbage Collection overhead.
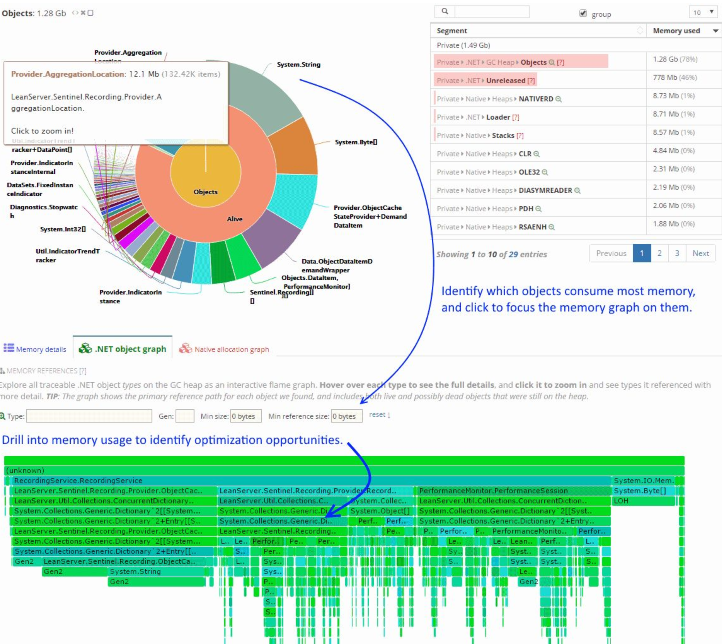
LeanSentry makes it possible to do advanced memory optimization quickly, facilitating patterns such as:
- Identify objects consuming most memory, and quickly identify where in the application they are referenced so they can be released.
- Identify objects located on expensive Gen2 and LOH heaps, so they can be optimized to reduce GC overhead.
- Identify objects being rapidly allocated/released (Gen0), to reduce stable memory usage and GC pressure.
- Many other strategies apparent from memory distribution.
Comments
0 comments
Please sign in to leave a comment.