What are hangs?
Hangs take place when the application code experiences a slowdown, causing affected requests to become blocked. When the blockage becomes severe enough, the application might run out of certain resources, e.g. threads in the thread pool, and stop being able to process additional requests completely or begin to queue them.
There are many reasons for why an application might hang, including slow SQL calls, deadlocks, slow network and IO operations, and so on.
You can use LeanSentry's Hang diagnostics to automatically detect hangs, and help your developers identify the cause of the blocking to quickly resolve it.
How to identify hangs in your environment using LeanSentry
Identifying a hang in your environment is very simple using LeanSentry.
Select the application for which you wish to identify hangs.

Select the hang diagnostics tab.

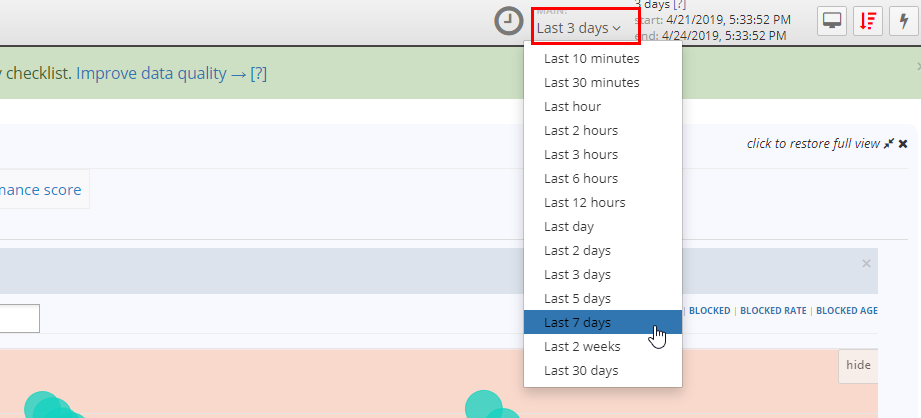
Then set the time frame.

Click on the 'blocked' option on the timeline graph to view the number of blocked requests over time. The default option is 'active' which shows the number of active requests over time (which can be higher without necessarily implying a hang).

Analyze the timeline by looking at the number of blocked requests over time. We can see some blocked requests spikes here. The bubbles indicate LeanSentry's attempt to diagnose hangs. Each bubble is a single point-in-time report that LeanSentry generated when it detected a hang. Hovering over these bubbles provides a summary of the diagnostic report.

![]() A solid blue bubble indicates a successful diagnostic attempt.
A solid blue bubble indicates a successful diagnostic attempt.![]() A blue translucent bubble indicates that LeanSentry identified a hang but was not able to diagnose it due to the current settings.
A blue translucent bubble indicates that LeanSentry identified a hang but was not able to diagnose it due to the current settings.![]() A red translucent bubble indicates a failed diagnostic attempt
A red translucent bubble indicates a failed diagnostic attempt
There are two main visual indicators for hangs caused by your application
1. The timeline graph shows spikes of blocked requests
2. We can see multiple diagnostic attempts by LeanSentry (represented by the bubbles)
Note: Sometimes the graph can take a while to load.
Filtering and opening hang reports
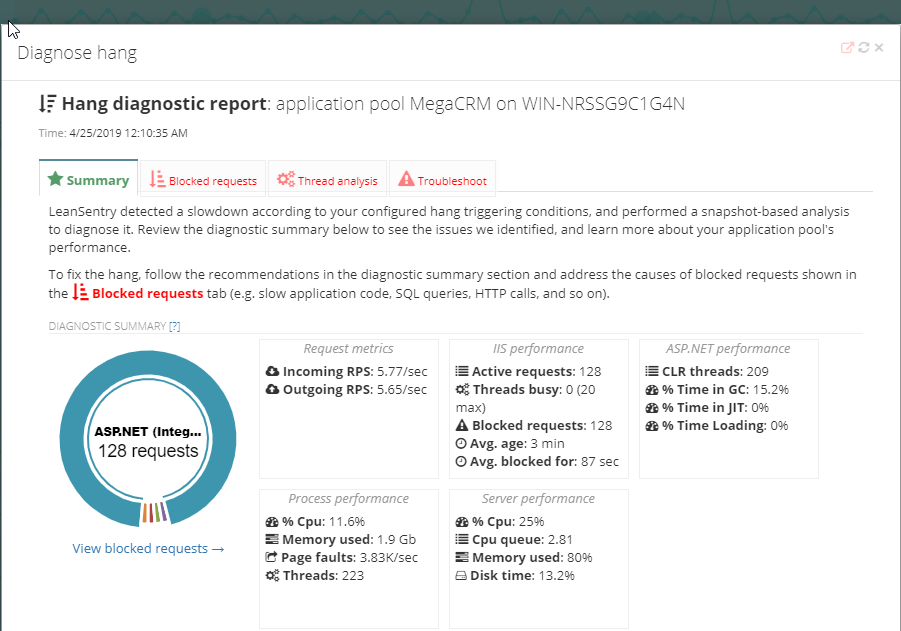
You can decide if a report could be of interest by looking at the number of requests that were blocked, the duration for which they were blocked and the quality of the report. A short summary of the report is also provided.

Additionally, you can filter reports by the type of issues they identify by clicking on the appropriate tag (found right above the reports)

Opening a hang report is fairly easy, simply choose the report you wish to explore and click open.

You can then use the a report details to determine the cause of the hang, down to your application code.

Conclusion
Hangs can cause slowdowns in your application and affect the user's overall experience. They usually occur in production environments and are difficult are hard to recreate. LeanSentry automatically diagnoses these hangs when they are seen and provides detailed reports. These reports usually clearly indicate actionable fixes. A developer can then use these reports to understand and resolve the issue.
Up Next: Interpreting a hang report

Comments
0 comments
Please sign in to leave a comment.