LeanSentry uses ETW tracing generated by your IIS worker process and the ASP .NET application framework to provide continuous monitoring and issue detection. While ETW traces are not required for most LeanSentry diagnostics, they provide valuable data for the following features:
- Slow operations (including custom application trackers and trackers added by ApplicationMonitoring.dll)
- Request traces: detailed execution traces for selected individual requests
- Performance score rules: a number of proactive performance analysis rules utilize ETW traces to determine opportunities for IIS tuning.
- Classic ASP error tracking (optional, if traces are configured as the source of errors)
If your server is not generating traces, please check the following:
- Tracing module is installed (an application pool recycle may be needed after installing to take effect).
- LeanSentry Diagnostic agent service is installed and running.
- The LeanSentry trace collector is running (see below).
- Your server has ongoing request traffic.
If you are still not seeing traces after a few minutes, please email support@leansentry.com for additional help.
Making sure the LeanSentry trace collector is running
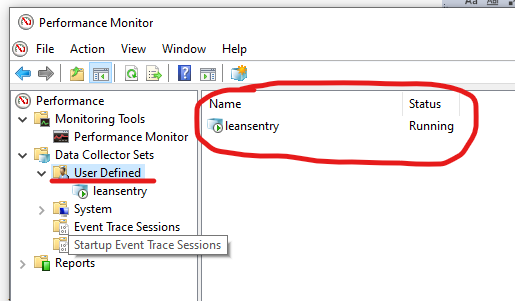
To make sure the LeanSentry trace collector is running:
- Start>Run> type "permon" and press Enter
- Open the "Data Collector Sets" node, and expand "User Defined"
- Make sure the "leansentry" data collector shows as "Running"

If the collector is not running, try starting it and wait for a minute. Refresh the status, and see if it's still running. If not, there may be an issue with tracing on your server. Please email support@leansentry.com for additional help.

Comments
0 comments
Please sign in to leave a comment.