In part 2 of this series, we will use a LeanSentry hang diagnostic report to determine the cause of the application hang. To learn about finding hang reports, go to part 1: Find application hangs with LeanSentry.
Understanding the key parts of the hang diagnostic report
Inside a hang report, you will see several tabs containing key information about the hang.

- Summary: The summary is one of the most important tabs in the report. It would provide details such as:
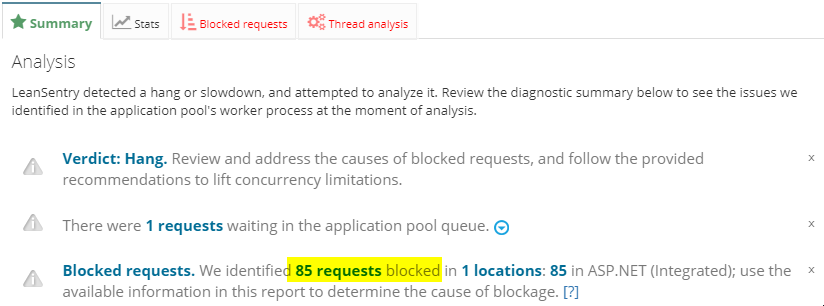
- Overview: A summary of the hang and the number of requests that were blocked when the report was generated.
- Functions blocking threads: Several threads could be blocked inside a few functions. Optimizing these functions should help resolve these types of hangs. LeanSentry analyzes the application stacks to identify the functions that were blocking most of the available threads.
Most of the times, these functions block threads due to long-running IO operations, such as database queries or outbound web service calls. In many of these cases, LeanSentry will also be able to identify which SQL query or HTTP URL that is being requested.
Clicking on the down arrow shows the complete stack trace of the place where the requests are being blocked.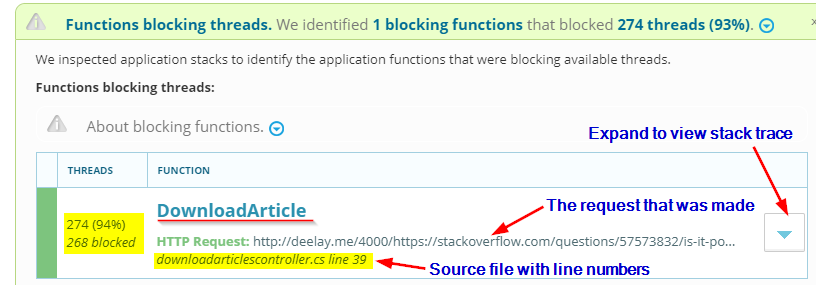
- Other factors contributing to the hang: Sometimes excessive CPU, memory, and/or disk usage could contribute (or cause) the hang. In that case, LeanSentry would mention them here in the summary. These types of hangs should be solved by resolving the underlying CPU, memory or disk usage issues using the other diagnostic features that LeanSentry provides.
- Overview: A summary of the hang and the number of requests that were blocked when the report was generated.
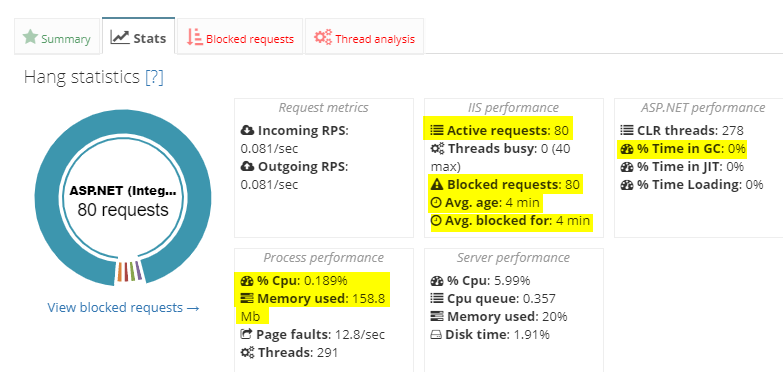
- Stats: The stats tab provides detailed information about the state of the application and the server when the hang occurred. This is useful in assessing the impact of the hang as well as in getting more details about the hang. This tab is particularly useful when LeanSentry determines that one of the causes for the hang was CPU, memory or disk issues.
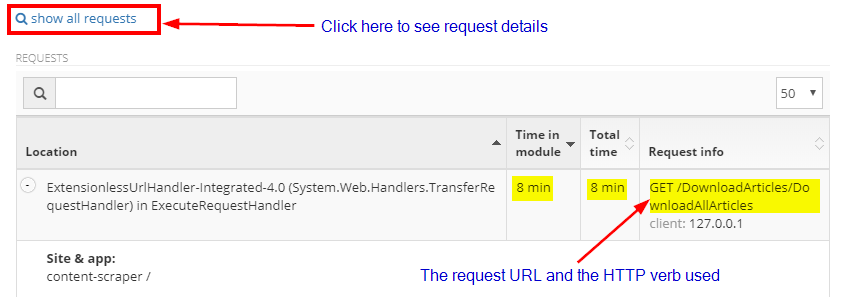
- Blocked requests: This tab provides two main information.
- The handler in which requests are blocked.

Here we can see that all the requests are stuck in ExecuteRequestHandler which basically means that the requests are stuck running some part of the application code.
💡TIP: If you see requests being stuck in AcquireRequestState, your application is likely suffering from session locking hangs. - Request information: When you click on 'show all requests', LeanSentry will show you details about the requests blocked inside these handlers.
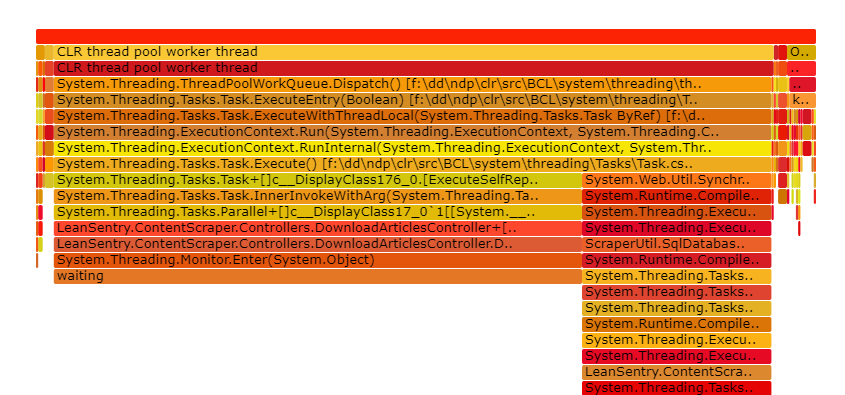
- Thread Analysis: This tab shows you a flame graph of the paths the requests followed. The wider each step (function call), the more threads entered that function.
This view helps us determine whether to select a bottom-up optimization approach or a top-down. If many threads follow the same execution path (wide paths till the end), we can optimize the function towards the bottom [end] of the path (bottom-up). However, if a wide path splits into several smaller function calls, it is best to try the top-down approach i.e. optimize the top-level function that made calls to several different functions that blocked these threads.
- The handler in which requests are blocked.
Locating the cause of the hang in the diagnostic report
- Open a hang report. Here we have chosen a report that blocked 85 requests (100%) for an average of 6 mins.

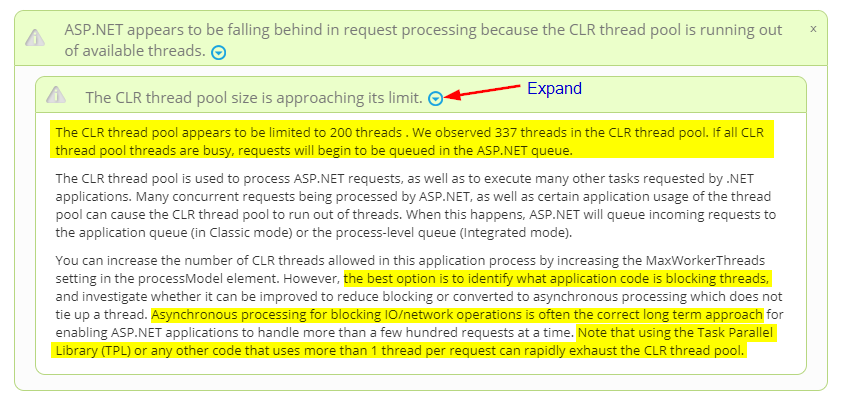
- Inside the summary tab of the report, we can see that there is application is running out of threads in the CLR thread pool. This clearly means that the application is suffering from thread pool exhaustion and threads are waiting/blocked on some operation (usually IO operation) and not returned to the thread pool for use during that time.
LeanSentry also provides hints on the possible issues and its resolution. Here we can see that using Task Parallel Library (TPL) could possibly be blocking these threads. The long-term optimization approach here is to use asynchronous tasks for IO operations.
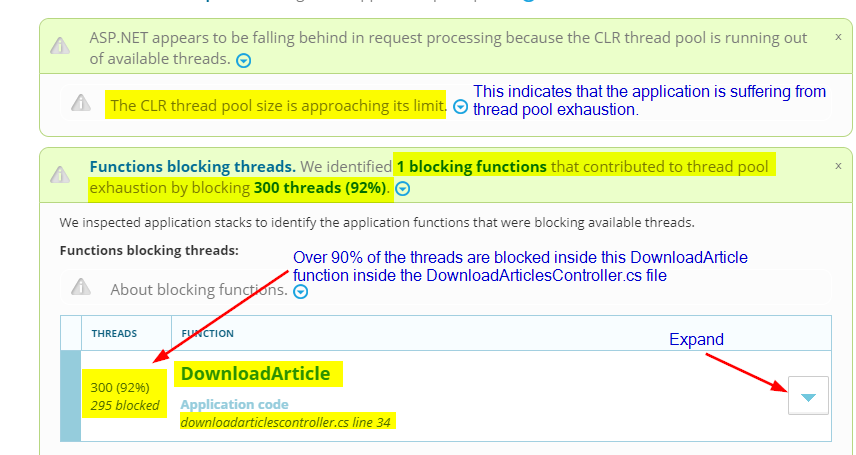
- Next, we determine the application code that caused the thread pool exhaustion. Just below the cause of the issue, we can see that LeanSentry has identified 1 function- DownloadArticle that blocked over 90% of the threads.
We can expand the function to see the stack complete stack trace by clicking on the expand button.
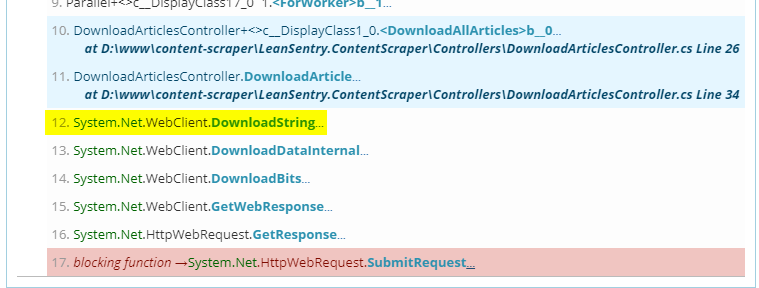
The stack trace when expanded is shown below:
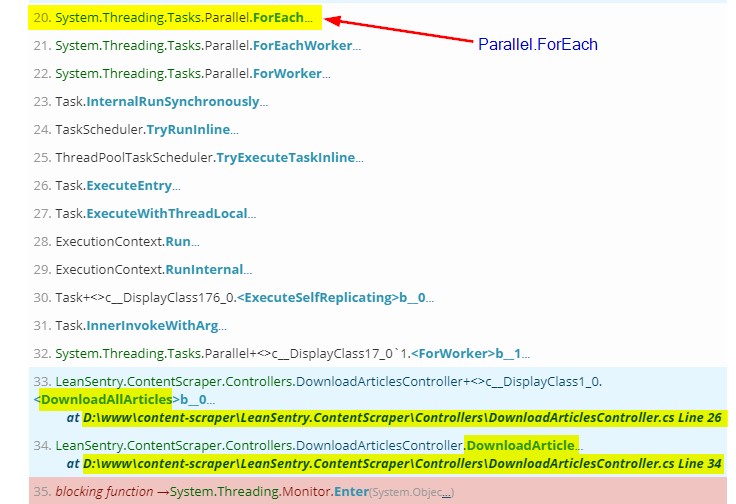
Looking at the stack trace, we can see a call to Parallel.ForEach. This call was made inside the DownloadAllArticles function at line 26 which in turn made a call to DownloadArticle on line 34 and blocked. Both the DownloadAllArticles and DownloadArticle are inside the DownloadArticlesController.cs file. - The Parallel.ForEach call does not return unless the slowest running operation completes (https://stackoverflow.com/questions/10153729/does-parallel-foreach-block). Now, let's check why the DownloadArticle function is causing the hang. The second stack trace shows that the DownloadArticle function made a slow HTTP request by calling the WebClient.DownloadString function. This is a synchronous function that blocks while downloading the resource (https://docs.microsoft.com/en-us/dotnet/api/system.net.webclient.downloadstring?view=netframework-4.8).
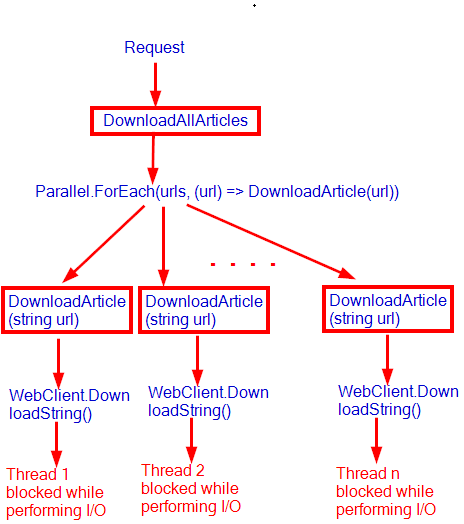
- So to summarize our observations -
- The DownloadAllArticles used Parallel.ForEach to call the DownloadArticle function.
- Several threads from the CLR thread pool were used to parallelly call the DownloadArticle function.
- The DownloadArticle function called WebClient.DownloadString and blocked the thread while performing an IO operation (making an HTTP request).
- Since Parallel.ForEach does not return until all operations have been completed, the request hangs. Every new request that calls the DowloadAllArticles function causes more and more of these threads to be blocked ultimately causing the thread pool exhaustion and thereby causing the application to hang.
Identify source code location of the hang
Locating the source code of the hangs is very simple using LeanSentry.
LeanSentry highlights the parts of your application code in light blue. In addition, many times LeanSentry also provides the line number and the source code file. In this case, we can see that the application code is at line numbers 26 and 34 of DownloadArticlesController.cs file.

LeanSentry highlights the parts of your application code in light blue. In addition, many times LeanSentry also provides the line number and the source code file. In this case, we can see that the application code is at line numbers 26 and 34 of DownloadArticlesController.cs file.

Next: Resolving the hang
Now that we have understood the reason behind the hang, we are ready to move on to the final step: Resolve an application hang using a LeanSentry hang diagnostic report.

Comments
0 comments
Please sign in to leave a comment.