In this 3 part series, we'll explore how you can use LeanSentry Memory diagnostics to find, diagnose, and resolve memory leaks and poor memory performance in a .NET web application.
Understanding memory leaks
Memory leaks usually happen when the application holds references to objects in the heap that are no longer being used. Luckily, they can be fixed once we have enough information about these objects and their reference paths.
Identifying a leak
Once you install LeanSentry on your server, LeanSentry will show you your application's memory usage over time under the memory diagnostic tab.
If you see the memory usage steadily creeping up, you can almost always be certain of a memory leak. You will see a positive slope similar to the one shown below.
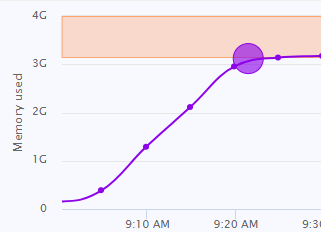
With a memory leak, the memory usage will keep on increasing until the application is recycled or the server is out of memory.
Adding additional hardware will only delay the symptoms of the leak for some time before the leak starts affecting the performance of the application again. For this reason, it is important to fix this issue at the application level by identifying the root cause of the issue.
LeanSentry's memory diagnostic cost
Unlike all other diagnostics (such as hangs and CPU diagnostics), memory diagnostics are disabled by default.
This is due to the overhead associated with it. LeanSentry attaches a debugger to the application process in order to diagnose it. It will then generate a mini-dump of the process and use it to find the objects that are in the memory and the reference paths for those objects. This can pause the application process for anywhere between 30 seconds to a couple of minutes. During this pause time, the web application will be unable to serve new requests.
Safely running a memory diagnostic
- If you are running a load balancer setup, temporarily remove the server on which you wish to run the diagnostics from the load balancer and trigger the memory diagnostics on it. Once the diagnostic completes, push the server back into the load balancer.
- Schedule or trigger the diagnostic during non-peak hours. This ensures that the diagnostic impact on the users is minimal.
- If you enable automatic diagnostics, disable it as soon as possible after a diagnostic report has been generated
-
Triggering a memory diagnostic manually
You can manually trigger a diagnostic by following the steps below:
-
Visit LeanSentry's dashboard and select the application you want to diagnose for memory leaks
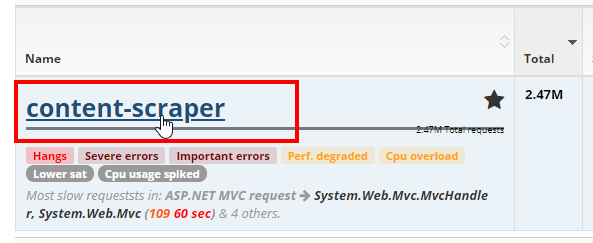
- Select the 'Memory diagnostics' tab

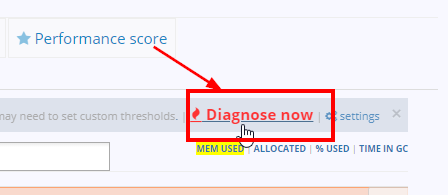
- Then click on diagnose now
- You will be presented with a popup like the one shown below:
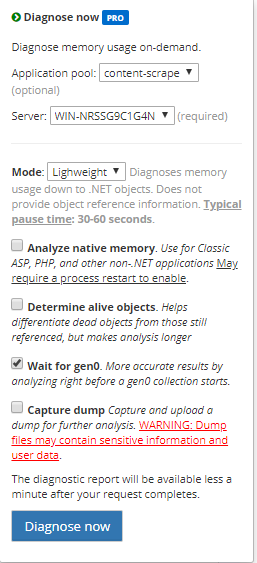
- Make your selections as follows:
- Application pool: Select the application pool that you wish to diagnose
- Server: Select the server from the list of servers being monitored. This is the server on which the diagnostics would run.
- Mode: LeanSentry offers two main diagnostic modes
- Lightweight: This mode would help you to find the objects in the memory and the generation-wise memory distribution of the heap. This mode is faster than the full mode but would not give you the reference paths. Good for initial assessment of the leak.
- Full: This mode includes everything included in the lightweight diagnostics + a reference graph showing where the objects are being referenced from. This takes a little longer to complete than the lightweight mode.
- Analyze native memory: It is best to leave this option unchecked unless you are analyzing native memory. Native memory is more difficult to optimize than managed memory.
- Determine alive object: Having this option checked would differentiate live objects (reachable objects) from the dead ones (non-reachable objects that have not yet been garbage collected).
- Wait for gen0: LeanSentry would wait for a Gen0 garbage collection before attaching the debugger. Diagnostic might take a while to complete due to the additional wait time. However, there is no impact during the wait and the process continues to serve requests during that time. Having this option checked is generally a good idea as the report would give a better idea of the objects that weren't garbage collected.
- Capture dump: LeanSentry can additionally capture a dump along with the diagnostic. This dump can later be analyzed to dig deeper into the issue. However, this can contain sensitive information. Use with caution.
- Click on 'Diagnose now' to start diagnosing

-
-
Enabling automatic memory diagnostics
You can enable automatic diagnostics based on selected thresholds.
- Visit LeanSentry's dashboard and select the application you want to diagnose for memory leaks

- Select the 'Memory diagnostics' tab

- Click on settings
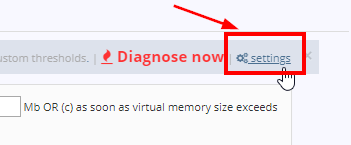
- Select the checkbox next to Diagnose memory. Then, in the first textbox enter the minimum memory threshold (in Mb) after which LeanSentry is allowed to diagnose the application pool. Once the threshold is reached, LeanSentry will start the memory diagnostic if it detects a memory leak or the memory usage reaches the limit specified in the second textbox. The thresholds need to be determined depending on the severity of the leak.

- Next, there are a few options to select from.
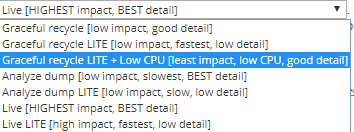
The two most commonly used modes are Graceful recycle LITE + Low CPU and Live. These roughly correspond to the lightweight and full mode of the manual memory diagnostics.
If you select the live mode, you will need to check an additional checkbox to confirm it.

- It is recommended to leave the other options untouched. If you wish to capture a dump with the diagnostic, check the last checkbox. Use caution with this option.

- Important: Click on save to save the settings
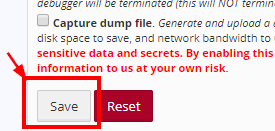
- Be sure to disable the diagnostic once a diagnostic report has been generated to avoid automatically triggering any more diagnostics. This can be done by unchecking the first checkbox

Don't forget to click on save after this step!
- Visit LeanSentry's dashboard and select the application you want to diagnose for memory leaks
Finding memory diagnostic reports
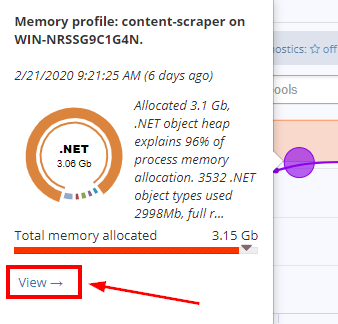
- Once a memory diagnostic report is generated, you will see a bubble on the timeline graph. You can hover over it to find a summary of the report.
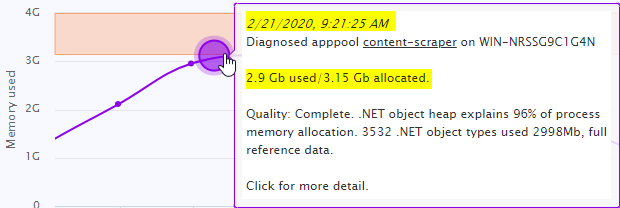
Clicking on the bubble allows you to view the report.
- You can also see a list of memory diagnostic reports under the timeline graph when you click on the reports tab
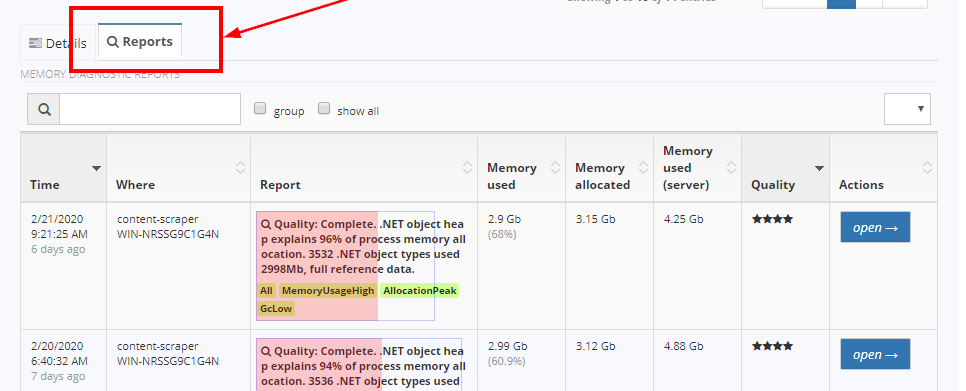
- You can sort the reports by clicking on the headings

- Time: Time when the report was generated.
- Where: Server on which the diagnostic was run.
- Memory used: Memory used by the application when the report was generated.
- Memory allocated: Memory allocated to the application for its use.
- Memory used (server): Memory used by the server. This includes all applications and processes.
- Quality: Each report is given a quality rating based on the level of details it contains and the impact. Higher the number of stars in the quality rating, the better the report.
- You can open the report by clicking on the open button
Next: Determine the cause of a memory leak using LeanSentry's diagnostic reports

Comments
0 comments
Please sign in to leave a comment.