
In part 2, we'll explore how to use the LeanSentry Memory diagnostics report to determine the cause of a .NET memory leak.
You can also read part 1: Find memory leaks with LeanSentry to see how to diagnose memory and find memory diagnostic reports in the LeanSentry dashboard.
Understanding the key parts of a memory diagnostic report
Once you open a memory report, you will two main tabs:
- Summary: This tab gives you detailed information about the application's memory usage when the report was generated.
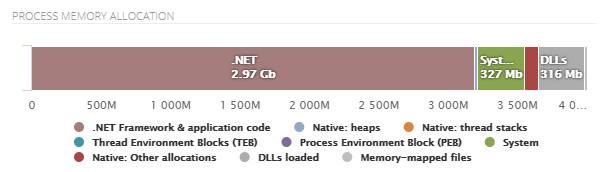
- Process memory distribution: This is the memory usage distribution of the applications in the app pool. The most important thing to note here is the memory usage by the .NET application and framework. If it's high, the application is a good candidate for optimization.
It also shows the native allocation which is usually more difficult to optimize than managed memory.
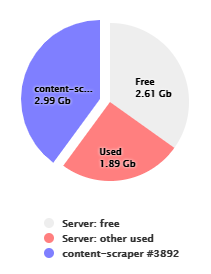
- Server memory distribution: Shows the memory distribution on the server including free space.
- Memory stats: Detailed memory stats are provided here. It is important to take note of the memory used by .NET (95% in the example below) and time spent in GC (<1%). From this we can conclude that the .NET applications are using most of the memory.

- Process memory distribution: This is the memory usage distribution of the applications in the app pool. The most important thing to note here is the memory usage by the .NET application and framework. If it's high, the application is a good candidate for optimization.
- Memory: This is the most important tab in the memory report. The following are the key sections:
- Generation-wise memory distribution: A nested pie chart shows you the generation-wise .NET memory distribution as well as the native allocation. This is super useful in seeing where the objects are in the managed heap.
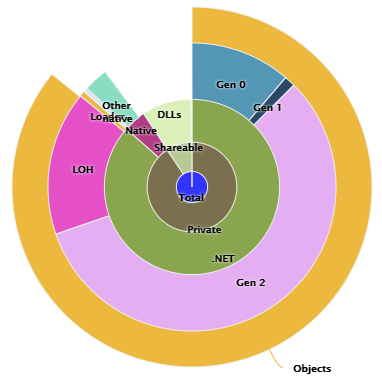
- If most of the allocation is in Gen0, it indicates that the application is creating a lot of short-term objects that are dereferenced before the next garbage collection(GC). They are garbage collected and do not move to Gen1.
- If most of the allocation is in Gen2, then we know that objects are being created in Gen0 but are not dereferenced (or dereferenced after a long time). These objects are then moved to Gen1 and subsequently to Gen2 during the next garbage collections. This indicates that the application is suffering from a memory leak.
- If most of the allocation is in the large object heap (LOH), the application is consistently creating objects that are greater than 85,000 bytes. These objects stay longer in the memory as they are collected only with Gen2 garbage collections.
In our example, we can see that most of the objects are in Gen2.
Clicking on Gen 2 in the pie chart shows you a distribution of the objects in Gen2.
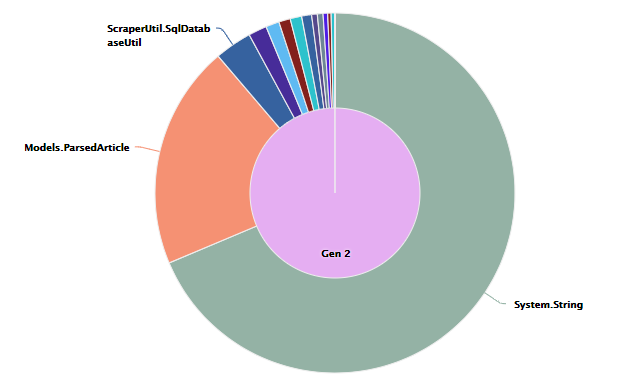
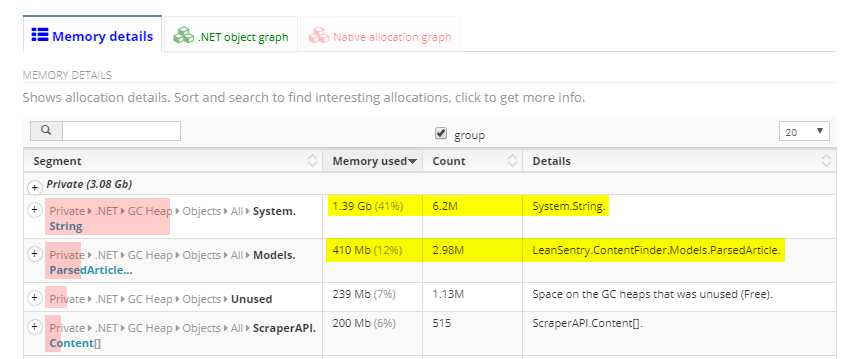
Here we can see that Gen 2 is mostly occupied by String objects and ParsedArticle.
- Memory details: The information above can also be gathered from the memory details tab which shows you the objects, their memory usage, and their counts.
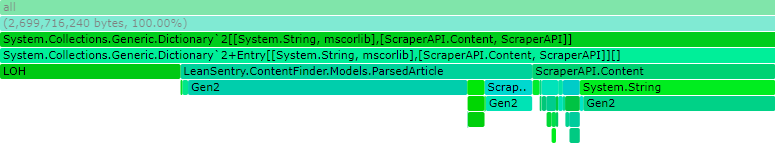
- .NET object graph: The .NET object graph is very useful in identifying the reference paths responsible for holding on to objects in the memory. The wider the rectangle for an object, the more memory it occupied in the memory. The objects at the top hold a reference to the ones below it and so on. These objects ultimately end up in one of the heaps.
- Native allocation graph: This provides the distribution of native memory (if the option was selected when capturing the memory report)
- Generation-wise memory distribution: A nested pie chart shows you the generation-wise .NET memory distribution as well as the native allocation. This is super useful in seeing where the objects are in the managed heap.
Locating the cause of high memory in the diagnostic report
- Check the process memory allocation to analyze the contribution of .NET code to the memory usage. Here we can see that a major chunk of the memory was used by .NET code and framework.
- Check the generation-wise memory distribution to understand where the objects are in the managed heap. In this example, we can see that most of the objects are inside Gen 2 heap. This is indicative of a memory leak.
- Click on the generation to see which objects are in that generation. For example, clicking on Gen 2 shows that most of the objects in Gen 2 are String and ParsedArticle.
- Analyze the .NET object graph to find the reference paths. Check for paths that are the widest. In this example, we can see that a dictionary of String and ScraperAPI.Content is holding on to ScraperAPI.Content which in turn is holding on to String objects in Gen2. We can also see that ParsedArticle is using a considerable portion of Gen2.
- Analyze the contents of the objects and references that they have. Break these references as soon as the object is no longer needed in order to ensure that the objects are garbage collected.
Summary:
1. We made sure that most of the memory is used by .NET applications code and framework.
2. We then noted that most of the objects are in Gen2 and are String and ParsedArticle objects.
3. We identified that the application is suffering from a memory leak.
4. We checked the reference paths and determined that there is a Dictionary<String, Content> that references Content objects that in turn reference String objects that remain on the heap.
Next: Resolve a memory leak using LeanSentry's memory diagnostic report
Comments
0 comments
Please sign in to leave a comment.