You can learn how to locate CPU diagnostic reports whenever your server or application experiences high CPU in part 1: Find high CPU usage with LeanSentry.
Understanding the key parts of the report
Once you open a CPU report, you will be presented with the following information:
- The CPU usage distribution: This shows you the distribution of CPU usage based on:
- Code: % CPU usage by the application code.
- .NET garbage collection: % CPU utilized in the garbage collection% CPU usage by other processes running on the server.
- Server idle time: % CPU unused on the server.

If your application code takes up a large chunk of the CPU usage (as is the case here), it is best to optimize the CPU consuming functions. If the high CPU usage is due to .NET garbage collection, optimizing memory usage to avoid frequent GC should help reduce the CPU usage. Finally, if the high CPU usage is due to other processes, it is a good idea to have a look at the other applications on the server and optimize them.
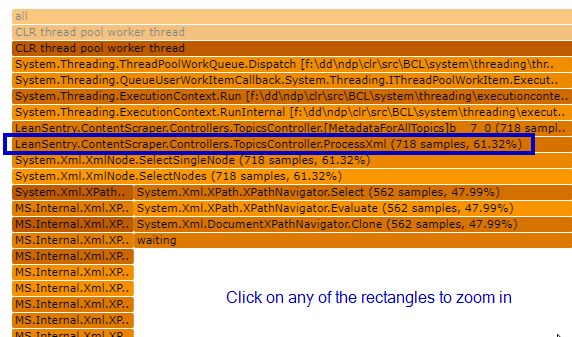
- Hot path: This is the most important part of a CPU report. It shows you the approximate percentage of CPU usage that each function is causing (directly or indirectly by calling other functions). Each rectangle represents a stack frame. The wider the rectangle, the more CPU usage that function has caused.
Here we can see that about 60% of the CPU usage was caused by the application function LeanSentry.ContentScraper.Controllers.TopicsController.ProcessXml.
💡TIP: You can zoom in to a stack frame and its children by clicking on its rectangle in the flame graph.
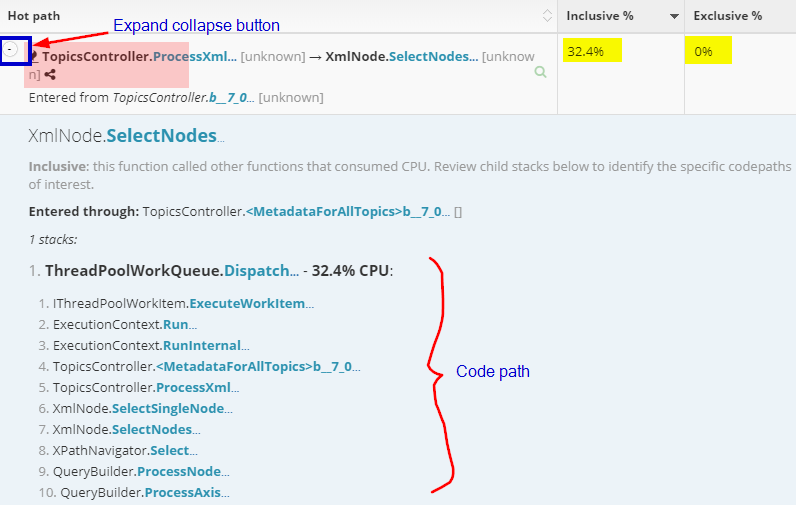
- Hot path functions: Just above the hotpath chart, you will see a summary of the functions with highest CPU usage. You can expand or collapse the function to see the code path.
The CPU usage is divided into inclusive and exclusive usage.- Inclusive: Function exclusive caused CPU usage. This function used a lot of CPU by itself e.g. looped through a huge array of data to process it one by one
- Exclusive: The function caused CPU usage indirectly by calling other CPU consuming functions.

Locating the cause high CPU in the diagnostic report
- Determine if the high CPU usage is due to the application, garbage collection or other applications. This can be determined by looking at the CPU % distribution.
In the example shown below, we can see that most of the CPU usage is caused by our application process code.

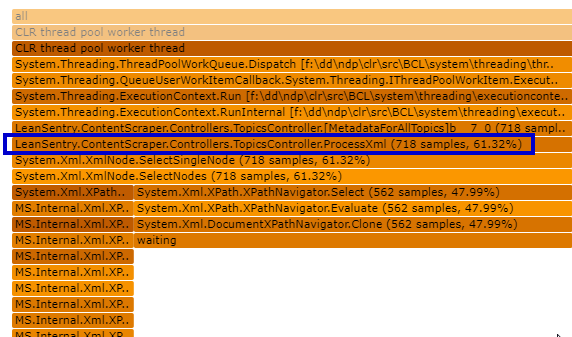
- Now, we look at the flame graph to identify the usage pattern. This would give us an idea of what is causing most of the CPU issue. In our report, we can see that the CPU usage was high when the function LeanSentry.ContentScraper.TopicsController.ProcessXml was called.

- Now to understand why our function is causing high CPU usage. Digging deeper into the flame graph, we notice that the function ProcessXml calls XmlNode.SelectSingleNode function that is CPU intensive. Xml processing is expensive and particularly loading an XmlDocument can take a lot of CPU time. This is the cause of high CPU usage.
Identify source code causing the elevated usage
The best way to identify your source code look at the flame graph and find your application code. Application functions usually have a namespace specific to the application/company while system code starts with the namespace 'System'.
Once you have identified the application code responsible for high CPU usage, you can begin to formulate strategies for optimizing it.
Conclusion
In this series, we have explored how to use the LeanSentry CPU diagnostic reports to find instances of high CPU usage in your application, and track the source of this usage to specific application code.
If you have CPU diagnostics and are not sure how to optimize your application in a specific case, please contact LeanSentry support for additional support options.

Comments
0 comments
Please sign in to leave a comment.