In this 2 part series, we will explore how to use LeanSentry CPU diagnostics to find, understand, and optimize application CPU usage.
This article shows how you can use the LeanSentry dashboard to find incidents of elevated CPU usage and overloads. You can also skip ahead to part 2: Determine the cause of high CPU usage using LeanSentry's CPU diagnostics.
Introduction
- If the server CPU is overloaded, all processing tasks can begin to take a longer time, resulting in generally degraded performance, application pool queueing, and slow requests.
- When the CPU usage is high, the .NET threadpool's ability to provide new threads is affected. This can cause thread pool exhaustion and request queueing.
You can use LeanSentry CPU diagnostics to identify when your server experiences CPU overload due to an application's high CPU usage, or when an application performance is degraded due to elevated CPU usage. Once diagnosed, you can use the CPU diagnostic reports to identify the code causing elevated CPU usage and discover ways to reduce/optimize the application's CPU usage.
Finding CPU reports
You can find these diagnostic reports by following the steps below:
- Using the application timeline graph
- Select the application for which you want to see the CPU reports

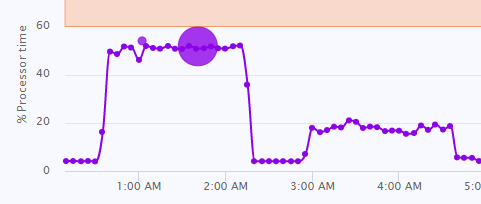
- Make sure you are inside the CPU diagnostic tab. You will then see a timeline graph with bubbles. These bubbles represent CPU diagnostic reports. Hover over them to get see a summary of the high CPU incident.

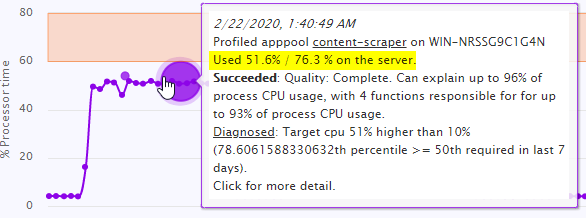
- Clicking on the bubble would allow you to open the report.
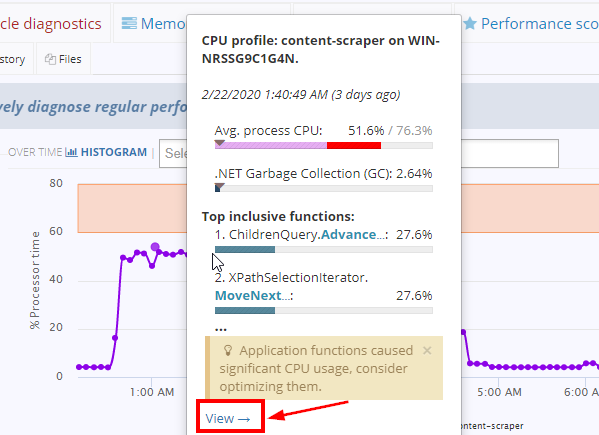
- Select the application for which you want to see the CPU reports
- Using the list of reports
This is useful in filtering important and most relevant reports.
- Just below the timeline graph, you will see a list of reports.
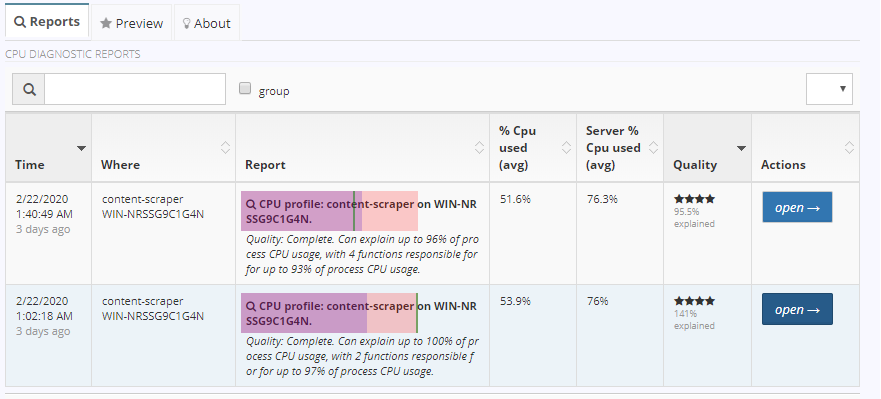
- You can click on the headings to order the reports according to:
- Time: The time when the CPU surge was detected and the report was generated
- Where: The server on which the CPU usage increased
- % CPU used (avg): The average % of CPU used by the application when the report was generated
- Server % CPU used (avg): The average % of CPU used by the server. This includes all applications and processes on the server.
- Quality: Reports are given a quality rating based on the level of details they contain and the impact. In general, purple stars are better than black stars and higher the number of stars, better the report.

- You can open the report by clicking on the open button.
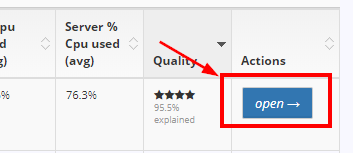
💡TIP: The best report is one that has a quality of 4 purple stars, the % CPU usage is high, the server CPU usage is high, and has been generated recently.
- Just below the timeline graph, you will see a list of reports.
Assessing the severity of the issue
- The timeline graph gives you an estimate of the duration for which there was heavy CPU usage on the server. Here we can see that there was a spike in CPU usage at about 12:30 AM and it lasted for roughly two hours.
- The reports would give you an idea of the actual CPU usage. When you open the report, you will be presented with information like CPU %, GC % and Server CPU %.

📃NOTE: The % CPU for the process is relative to the server CPU usage. In the screenshot above, the application process used ~50% of the total server usage (which was ~75%).
A report with very high process CPU usage but low server CPU usage is usually not a good report to start working with.

Comments
0 comments
Please sign in to leave a comment.