In this 3 part series, we will explore how to use LeanSentry Hang diagnostics to find, understand, and resolve application hangs.
This article provides a quick overview of hangs, and how to locate hang reports in your LeanSentry dashboard. You can also skip ahead to part 2: Determine the cause of a hang using LeanSentry's hang diagnostics and part 3: Resolve an application hang using a LeanSentry hang diagnostic report.
What are hangs?
A website is considered to be hanging when it appears to stop serving incoming requests, with requests either taking a very long time to complete or timing out. The requests are considered to be blocked and each request could be blocked for a few seconds to several minutes.
LeanSentry, by default, considers requests to be blocked when they take 8 seconds or more to complete (this can be customized easily in the settings)
LeanSentry, by default, considers requests to be blocked when they take 8 seconds or more to complete (this can be customized easily in the settings)
Finding hang reports
LeanSentry automatically identifies and diagnoses hangs in production web applications. Each time it detects a hang, a diagnostic report is generated highlighting the severity of the issue and the cause.
There are three easy ways to find these diagnostic reports
-
Using the dashboard homepage
This method is particularly useful when you are trying to see if any of your monitored applications have experienced a hang recently.
- When you land on the dashboard, you will see a general timeline of your application's performance. The red bubbles indicate any hang diagnostic attempts by LeanSentry.
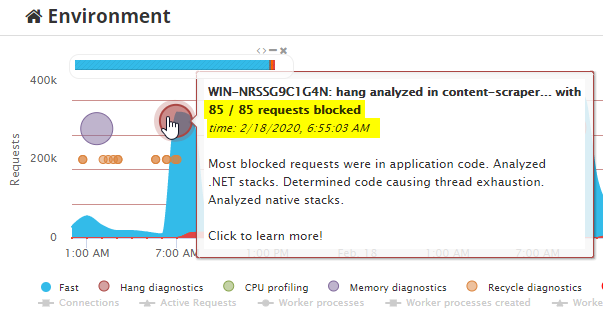
- Hover over these bubbles to get a summary of the hang. This includes the exact time of the hang, which website was hanging and how many requests were blocked.
- Clicking on the bubble gives you an option to open that particular report by clicking on the 'View' button.
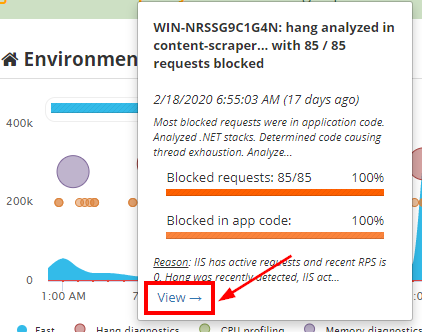
- When you land on the dashboard, you will see a general timeline of your application's performance. The red bubbles indicate any hang diagnostic attempts by LeanSentry.
-
Using the application timeline graph to find hangs in a particular application
This method is useful when you are interested in finding hang reports for a particular application. Please follow the steps below:
- Select the application for which you want to see the hang reports.

- Make sure you are inside the hang diagnostic tab. You will then see a timeline graph with bubbles in case LeanSentry diagnosed hangs in the application. These bubbles represent hang diagnostic reports. Hover over them to get see a summary of the hang.

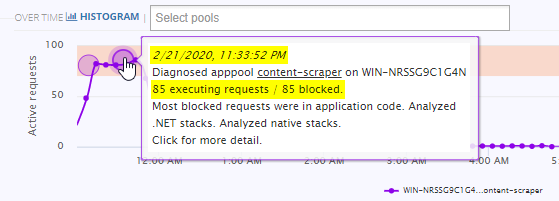
- Clicking on the bubble would allow you to open the report.
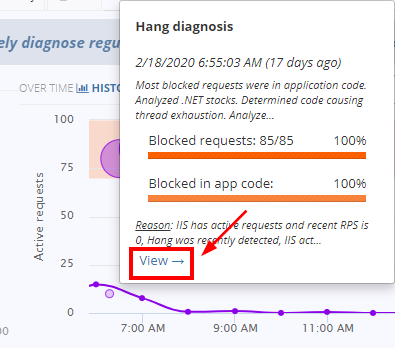
- Select the application for which you want to see the hang reports.
-
Using the list of reports in an application
This is useful in filtering important and most relevant reports for an application.
- Just below the timeline in the application, you will see a list of reports.

- You can click on the headings to order the reports by:
- Time: The time when the hang occurred
- Where: The server on which the hang occurred
- Blocked: The number of requests blocked
- Duration: The average time a request took when the hang occurred
- Quality: Reports are given a quality rating based on level of details they contain and the impact of the hang. In general, a report with purple stars is better than one with black stars. Higher the number of stars associated with the report, the better is the report.

- You can open the report by clicking on the open button.
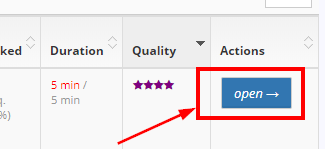
💡TIP: The best report is one that has a quality of 4 purple stars, has a lot of blocked requests for a good duration of time and has occurred recently.
- Just below the timeline in the application, you will see a list of reports.
How severe is my hang?
Hang impact is generally measured by the number of requests blocked and the duration of the hang. The stats tab of a report would give you detailed information about the hang.
The "IIS Performance" section of the report would show you the number of active requests and how many of them are blocked. It also shows you the average time the requests are blocked for.
- Open an interesting hang report,
- Go to the stats tab,
- Check out the stats to assess the severity of the hang.
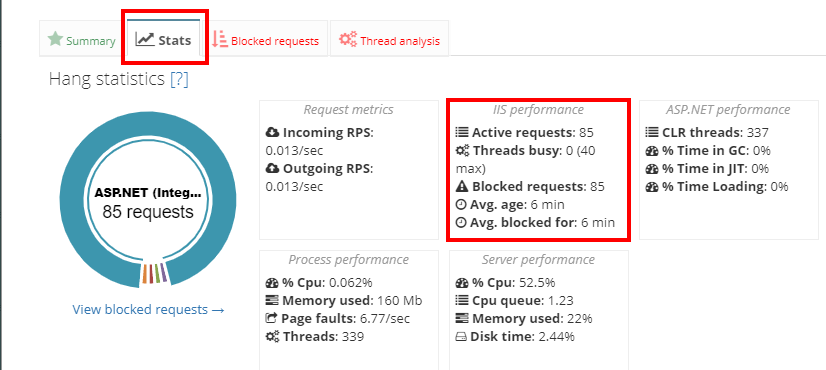
In the screenshot above, we can see that all 85 requests are blocked for an average of 6 mins (which is severe because users have to wait for approximately 6 minutes after making a request to receive a response from the server).
Next: Determining the cause of the hang
Continue to Determine the cause of a hang using LeanSentry's hang diagnostics to learn how to use the hang diagnostic reports to determine the cause of website hangs.

Comments
0 comments
Please sign in to leave a comment.