NEW! LeanSentry's slow operation tracking feature lets you get deeper visibility into the execution of your application, and identify the operations that increase page load time.
You can use slow operation tracking to:
-
Determine what causes slow page loads for your website, or a specific URL.
-
Track the performance of specific SQL queries, IIS modules, and HTTP/REST services.
-
Instrument your application code, for lightweight 24/7 performance profiling and debugging in production.
NOTE: LeanSentry's slow operation tracking is implemented via lightweight tracing, and does not require a debugger or profiler.
Watch a slow operation tracking demo!
Log in to your account to enable slow operation tracking.
New to LeanSentry? create your trial account.
Contents:
-
Using slow operation tracking
-
How to enable slow operation tracking in your applications
-
Frequently asked questions
Using slow operation tracking
To use:
- Go to the application's Performance page or the URL details page for any application URL.
- Scroll down to the Performance section of the page:
- You'll see the "N operations contributed to request processing time" insight:
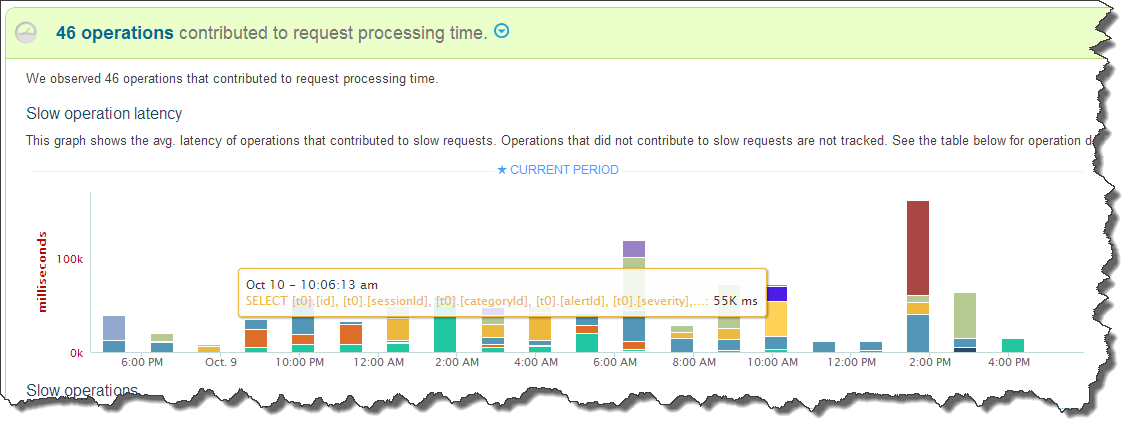
The slow operations insight shows the operations contributing the highest latency to slow requests for the website or URL affected. - Scroll further down to a table listing the operation details:
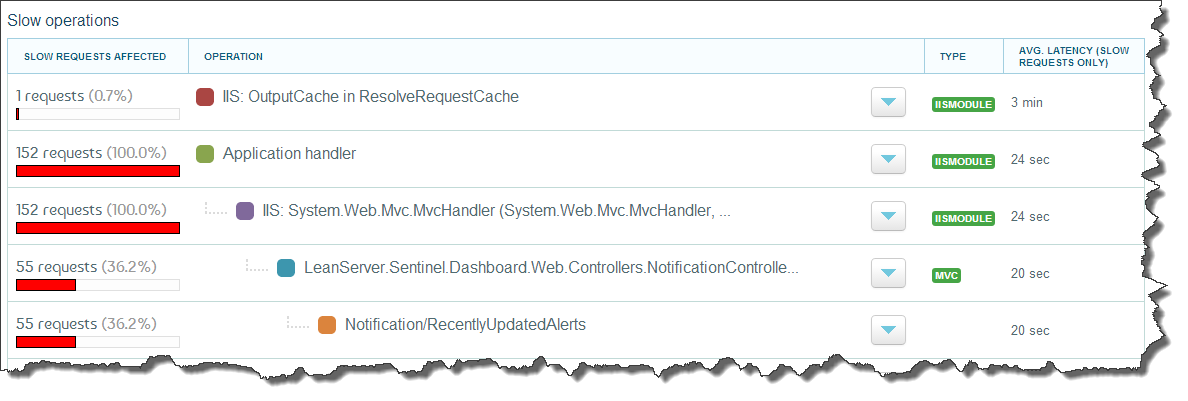
The slow operations table shows a tree of operations. Each operation indicates how many slow requests it affected on the right, and the avg. operation duration during those requests on the left. - Expand each operation to vew operation details, including SQL query text or application stacktrace:
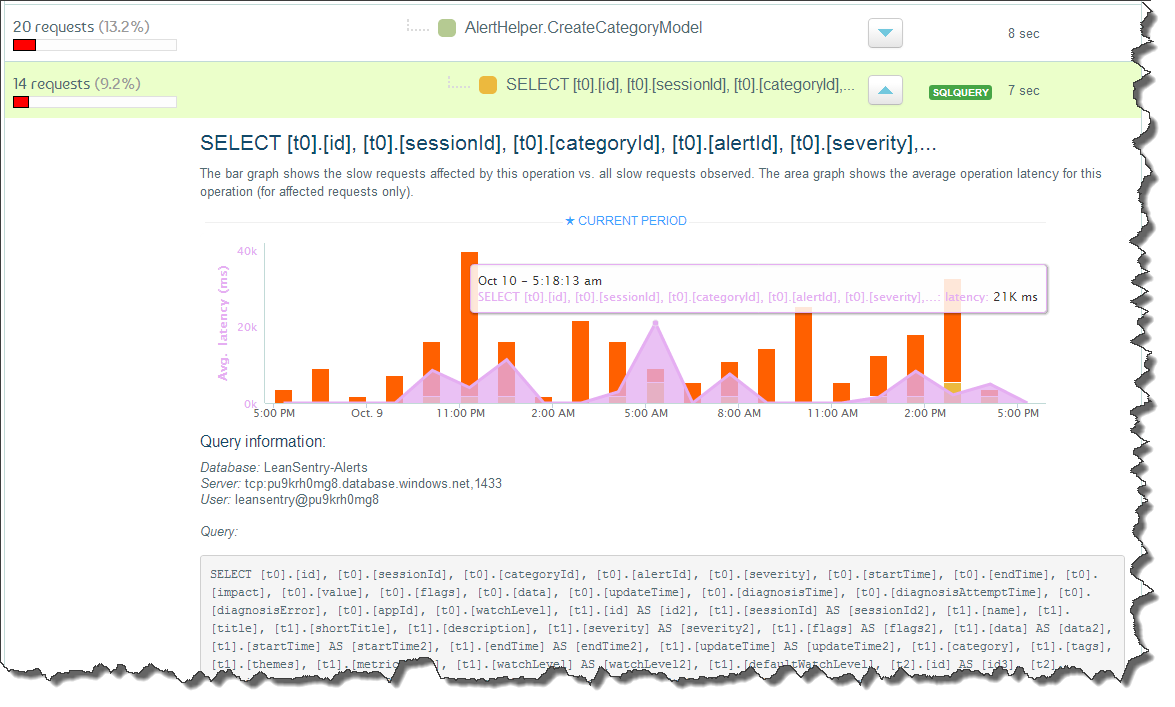
Expand each operation to view the operation details. This includes a complete performance history of how many slow requests were affected by this operation vs. other slow operations, and the avg. operation duration during slow requests. It also shows the operation-specific details, such as application stacktrace or SQL query text. - Finally, you can also view the sampled detailed request traces that involved this operation.
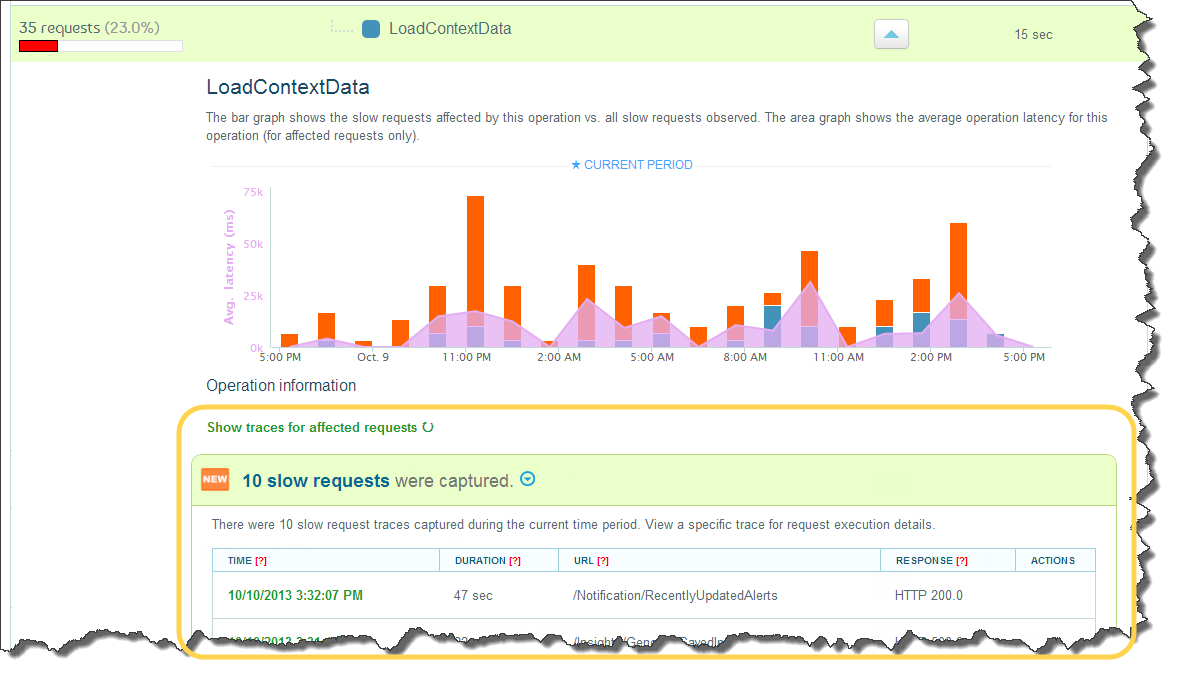
Click "Show traces for affected requests" to view the detailed request traces for requests affected by this operation.
Enabling slow operation tracking in your applications (requires LeanSentry Agent)
Leansentry's slow operation tracking provides profiler-level or deeper insight into your application's execution ... without a profiler!
It works by tracking operations that take place during the execution of the request, and correlating that data with the request-level monitoring information LeanSentry already collects. LeanSentry can track the following operations:
-
IIS and ASP.NET modules.
-
SQL queries.
-
HTTP/REST service calls made by your application (*)
-
Application code (*)
(*) Requires optional LeanSentry.ApplicationMonitoring.dll library.
The LeanSentry Agent automatically tracks operations that are traced by IIS and ASP.NET, such as IIS/ASP.NET modules and SQL queries.
To enable tracing of HTTP/REST service calls, and arbitrary application code, your application needs to use LeanSentry.ApplicationMonitoring.dll library.
Tracking application code operations with LeanSentry.ApplicationMonitoring.dll
This is a lighweight application instrumentation library that you can use to trace arbitrary operations within your application code.
Unlike a profiler, which indiscriminately intercepts the execution of every method inside your application and usually has a significant performance overhead, this approach allows you to control how much instrumentation you want to have. As a result, it allows you to get continuous 24/7 operation tracking in production without the overhead.
In most cases, having just a few tracked operations at the top level is enough to identify the cause of slow loads. Then you can simply add more instrumentation to get more resolution.
To enable LeanSentry.ApplicationMonitoring, simply do the following:
-
Deploy LeanSentry.ApplicationMonitoring.dll and LeanSentry.ApplicationMonitoring.Automatic.dll (ASP.NET 4.0+ only).
>> DOWNLOAD: LeanSentry.ApplicationMonitoring.zip [updated 7/10/2021]
Copy the appropriate DLLs to your application's /BIN directory. Use the table below to select the right configuration:
APPLICATION VERSION LIBRARIES TO USE
.NET 2.0/3.5 (NO MVC)
LeanSentry.ApplicationMonitoring.dllAdditional configuration:
Call Monitoring.Start() in global.asax:
[C#]
protected void Application_Start()
{
    // Start operation tracking
    LeanSentry.ApplicationMonitoring.Monitoring.Start();
}
[VB.NET]
Sub Application_Start(ByVal sender As Object, ByVal e As EventArgs) // Start operation tracking LeanSentry.ApplicationMonitoring.Monitoring.Start(); End Sub
.NET 4.0+ (NO MVC)
LeanSentry.ApplicationMonitoring.dll
LeanSentry.ApplicationMonitoring.Automatic.dll
Additional configuration: NONE, tracking is enabled automatically.
.NET 4.0 +
ASP.NET MVC 3.0
LeanSentry.ApplicationMonitoring.dll
LeanSentry.ApplicationMonitoring.Automatic.Mvc.dllAdditional configuration:
TIP: You specify your application's target MVC version in web.config in the newVersion attribute:
<configuration>
 <runtime>
    <assemblyBinding xmlns="urn:schemas-microsoft-com:asm.v1">
      <dependentAssembly>
        <assemblyIdentity name="System.Web.Mvc" publicKeyToken="31bf3856ad364e35" />
        <bindingRedirect oldVersion="0.0.0.0-5.0.0.0" newVersion="3.0.0.0" />
      </dependentAssembly>
    </assemblyBinding>
 </runtime>
</configuration>
.NET 4.0 +
ASP.NET MVC 4.0
LeanSentry.ApplicationMonitoring.dll
LeanSentry.ApplicationMonitoring.Automatic.dllAdditional configuration:
TIP: You specify your application's target MVC version in web.config in the newVersion attribute:
<configuration>
 <runtime>
    <assemblyBinding xmlns="urn:schemas-microsoft-com:asm.v1">
      <dependentAssembly>
        <assemblyIdentity name="System.Web.Mvc" publicKeyToken="31bf3856ad364e35" />
        <bindingRedirect oldVersion="0.0.0.0-5.0.0.0" newVersion="4.0.0.0" />
      </dependentAssembly>
    </assemblyBinding>
 </runtime>
</configuration>
.NET 4.0 +
ASP.NET MVC 5.0
LeanSentry.ApplicationMonitoring.dll
LeanSentry.ApplicationMonitoring.Automatic.dllAdditional configuration:
TIP: You specify your application's target MVC version in web.config in the newVersion attribute:
<configuration>
 <runtime>
    <assemblyBinding xmlns="urn:schemas-microsoft-com:asm.v1">
      <dependentAssembly>
        <assemblyIdentity name="System.Web.Mvc" publicKeyToken="31bf3856ad364e35" />
        <bindingRedirect oldVersion="0.0.0.0-5.0.0.0" newVersion="5.0.0.0" />
      </dependentAssembly>
    </assemblyBinding>
 </runtime>
</configuration>
NOTE: LeanSentry.ApplicationMonitoring.Automatic.Mvc.dll automatically enables tracing for ASP.NET MVC controller actions and views without additional code changes. It only works for applications using ASP.NET 4.0+.
If you are using an older version of the framework/MVC, do not use this library - instead simply instrument your code with trackers. You can use the included action and view wrapper classes to manually instrument your MVC controllers and views.
In both cases, LeanSentry.ApplicationMonitoring.dll will allow you to trace outgoing HTTP/REST calls made by your application, and any custom trackers you add.
WARNING: To insure security, make sure the libraries are signed by LeanServer LLC: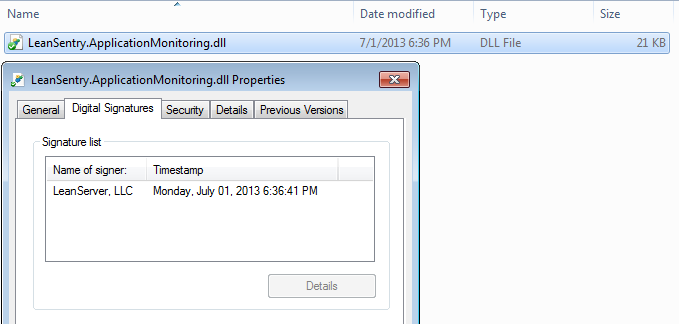
-
Use new Tracker("OperationName") to track any operation in your code!
[C#]
    using (new Tracker("Downloading data"))
    {
        // Do something ...
    }
[VB.NET]
Using tracker As New Tracker("Downloading data") ' Do something ... End Using
You can also do more with trackers:
- Log arbitrary information using trackers for debugging purposes, and have this information show up in your detailed request logs:
[C#]
    using (var tracker = new Tracker("Downloading data"))
    {
        // Do something ...

        // Set information for debugging
        tracker["result"] = data;
    }
[VB.NET]
Using tracker As New Tracker("Downloading data") ' Do something ...
' Set information for debugging
tracker("result") = data; End Using
- Control how much information the tracker will capture. The tracker can automatically capture application stack traces, and CPU usage of application code it surrounds.
[C#]
    using (var tracker = new Tracker("Downloading data", TrackingDetail.CpuTime | TrackingDetail.FullStack))
    {
        // Do something ...
    }
[VB.NET]
Using tracker As New Tracker("Downloading data", TrackingDetail.CpuTime or TrackingDetail.FullStack) ' Do something ... End Using
Frequently asked questions
1. How does LeanSentry track operations?
The operations are tracked from the lightweight ETW event trace generated for each request by IIS.
2. What is the performance impact of operation tracking?
The impact for most workloads is typically less than 1% CPU even if you have thousands of trackers per second, due to the high-performance nature of ETW tracing. The LeanSentry.ApplicationMonitoring.dll library was tested with workloads up to 5000RPS per server, with negligible performance overhead. This is significantly faster than most other application instrumentation libraries including System.Diagnostics or log4net.
Additionally, because LeanSentry.ApplicationMonitoring only traces operations you chose, it has SIGNIFICANTLY lower overhead then a profiler.
3. Where can I see custom information I log with the Tracker class?
You can see all traced operations, and all of their custom state, when viewing the detailed request trace for the request. You can find detailed request traces for slow or failed requests on the website's Performance page, the URL details page for a specific URL, or when viewing any of the tracked slow operation entries.
4. How do I debug tracing errors?
Startup exceptions
If the library encounters a problem, it WILL NOT prevent your application from starting by default.
Instead, it will log the error to the EventLog (it will be visible in the LeanSentry dashboard).
If you would like to debug any tracing issues, you can enable startup exceptions to be thrown by adding the following:
<configuration>
  <appSettings>
    <add key="LeanSentry.ApplicationMonitoring.ThrowStartError" value="true" />
  </appSettings>
</configuration>
*** WARNING: Enabling startup exceptions will cause any tracing errors to break your application. DO NOT publish to production with this flag.
Tracing exceptions
You can also intercept any errors that take place during logging of individual trackers by listening on the LeanSentry.ApplicationMonitoring.Monitoring.Error event.
5. How can I turn tracing on/off programatically?
If you need to toggle tracing on/off from code, you can do so by setting LeanSentry.ApplicationMonitoring.Tracker.Enable.
// Turn off all tracking
LeanSentry.ApplicationMonitoring.Tracker.Enable = false;
// Turn tracking back on
LeanSentry.ApplicationMonitoring.Tracker.Enable = true;
Summary
LeanSentry's slow operation tracking can help you identify what operations cause slow page loads, and help you monitor performance at the code level.
To enable code-level operation monitoring, deploy the LeanSentry.ApplicationMonitoring library and instrument your code with the Tracker class.
If you have any questions or need help getting started, email us!
Log in to your account to enable slow operation tracking.
New to LeanSentry? create your trial account.

Comments
0 comments
Article is closed for comments.