Overview
All of a sudden, your website appears to have stopped working. Pages are taking forever to load. Your site is experiencing a hang.
A hang occurs whenever your website appears to stop serving incoming requests, with requests either taking a very long time or timing out. It's generally caused by all available application threads becoming blocked, causing subsequent requests to get queued (or sometimes by the number of active requests exceeding various concurrency limits).
Hangs are fairly common for production applications, and can be incredibly frustrating to troubleshoot because it could be caused by so many different problems across IIS, ASP.NET, and your application code.
Thankfully, you can now use LeanSentry to automatically detect and diagnose the root cause of a hang whenever it occurs in your production web application.
Table of contents
- Turning on Hang diagnostics
- How to use the Hang diagnostics to resolve hangs
- How the Hang diagnostic works (and its impact)
- Known issues
Turning on Hang diagnostics
- Make sure the LeanSentry Agent is installed on each server.
The LeanSentry Agent is installed automatically on each server when using the "Simple" deployment type. If you used the "Advanced" deployment type for your environment, you may need to download and install the Agent separately from your environment settings. -
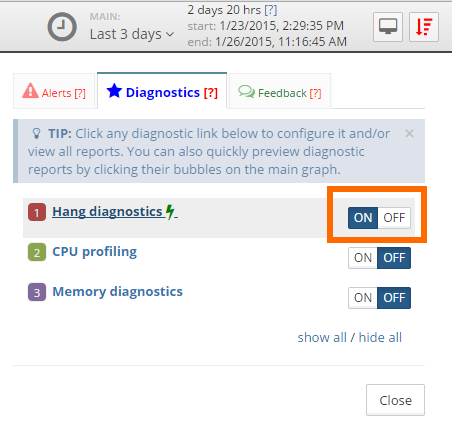
Open the Hang diagnostics task in the Diagnostics sidebar:
-
Enable the Hang diagnostics globally for your entire environment (OR you can also enable it for a specific site in the next step)
To enable globally for all websites, check the "Enable hang diagnostics" AND the "Diagnose all websites" checkboxes and click Save:
Application pool recycle note: The default "Analyze and recycle" hang diagnostic mode attaches a debugger to your application pool's worker process to perform the hang analysis, and performs an application pool recycle seconds later to insure completely clean operation. In most cases, the website is already experiencing a hang, and the recycle automatically helps clear it. If the application pool recycle is not acceptable in your environment, consider the Lightweight or Analyze modes.
See "Tuning Hang diagnostic settings" for more tips on configuring hang diagnostics. - Alternatively, select a website to enable Hang diagnostics for a specific site.
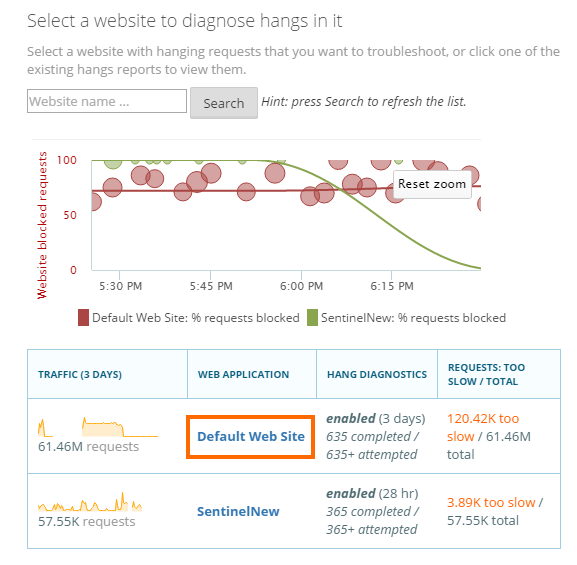
Then, configure hang diagnostics for the website: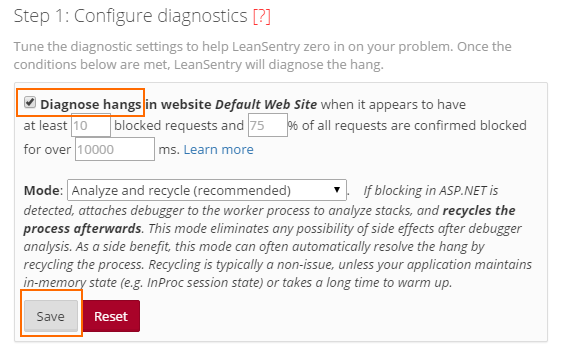
Application pool recycle note: The default "Analyze and recycle" hang diagnostic mode attaches a debugger to your application pool's worker process to perform the hang analysis, and performs an application pool recycle seconds later to insure completely clean operation. In most cases, the website is already experiencing a hang, and the recycle automatically helps clear it. If the application pool recycle is not acceptable in your environment, consider the Lightweight or Analyze modes.
See "Tuning Hang diagnostic settings" for more tips on configuring hang diagnostics. -
Thats it! LeanSentry will now begin monitoring your environment/website for hangs and diagnosing them automatically.
See the next section for how to access and analyze the Hang diagnostics reports.
Using the hang diagnostic to resolve hangs
The hang diagnostic analyzes the hang, and attempts to identify common causes of request blocking that typically causes hangs.
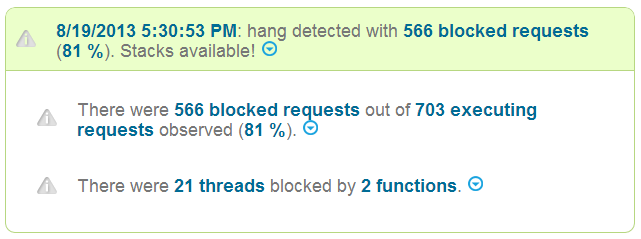
The report will generally contain three sections:
1. Problems detected
LeanSentry will automatically detect many common misconfiguration and threadpool exaustion problems that contribute to hangs, and indicate how you can address them.
This includes:
1. ASP.NET threadpool exaustion, causing ASP.NET to run out of request threads.
2. IIS theadpool exaustion, causing IIS to fall behind in dequeueing requests / request queueing in the application pool queue
3. Insufficient concurrency limits causing requests to get queued/rejected.
4. OS concurrency limits
In many cases, the hang is actually caused by ASP.NET threads becoming blocked due to blocking functions. The following sections of the diagnostic will help you identify these.
2. Blocked requests
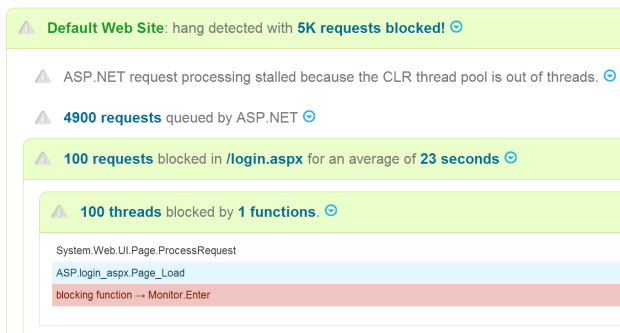
This section will separate the queued requests (waiting for execution due to the server falling behind in request processing), from the requests that are actually causing the hang by tying up server resources.
This immediately identifies the URLs that are causing the hang, and which part of the request processing pipeline the hang is occurring in. For example, you can identify whether the hang is happening in your application code, sending the response, or a custom module. You can also inspect the specific requests causing blocking for any information that may suggest why they are causing blocking.
3. Blocked threads
If LeanSentry was successfully able to diagnose .NET application stacks, this section will identify the specific functions in your code that are causing the hang. Look for any functions that are tying up a large number of request threads.
Each function will indicate how many threads were blocked by it, and provide all unique callstacks indicating where in the code the processing was stalled. Feel free to ignore any functions that have a small number of threads as these are not likely to significantly infuence the hang.
If the function is making a SQL query or HTTP request to an externals service, the diagnostic will also show you the corresponding SQL query or service URL.
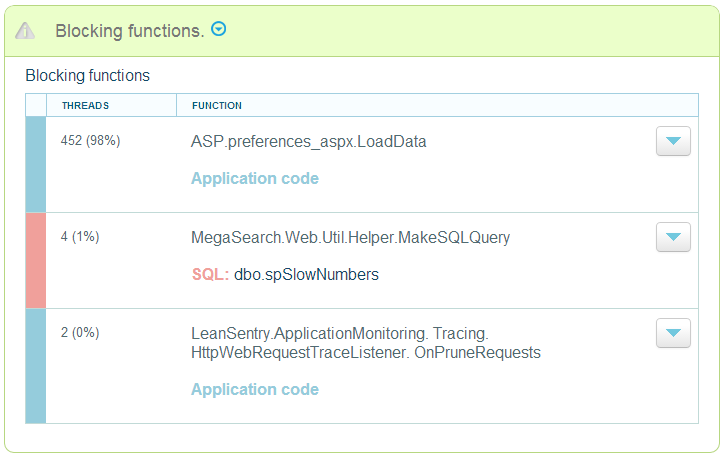
Expand each function to view the function information and detailed stack traces.
How Hang diagnostics work
The hang diagnostic works like this:
1. The LeanSentry Monitoring service monitors each application pool for signs of hangs, using standard lightweight monitoring that has virtually 0 overhead on your server. Because hang detection can be very unreliable, LeanSentry watches over 10 different signs including performance counters.
2. When a likely hang is detected, the LeanSentry Monitoring service confirms the hang by snapshotting currently executing requests via the IIS RSCA API. This again is a lightweight mechanism, and does not require any debuggers or profilers to be loaded in the application.
3. If the hang is confirmed, LeanSentry attaches a debugger to the worker process and performs detailed analysis of the hang.
NOTE: This analysis usually takes 2-5 seconds. However, because this analysis is only performed is the application already experiences a hang, it is virtually unnoticeable to your users.
Analysis frequency: LeanSentry limits how often the full hang diagnosis is performed. By default, it will only perform the full diagnosis 3 times an hour per application pool, and 20 times a day total per server. If you would like to adjust this frequency, please email support.
4. The LeanSentry Monitoring service uploads the hang diagnosis information for analysis, along with application pool configuration details needed to completely diagnose the hang.
5. LeanSentry service analyzes the diagnostic data, and determines the root causes of the hang.
6. The detailed diagnostic report becomes available in your dashboard!
Known issues
Please review the following known issues if you are having trouble getting the hang diagnostic to work.
1. The application pool may be recycled after the hang diagnosis completes.
LeanSentry recycles the application pool after the hang diagnosis completes. In most cases, this actually results in the clearing of the hang. If you would like to disable application pool recycling, please contact support.
2. Blocking function / callstack information may not be available on every diagnosis.
Blocking functions are only determined if LeanSentry detects blocking in .NET code (as opposed to in IIS or native modules), and is able to perform the debugger-based analysis of the hang. LeanSentry may fail to perform a full diagnosis if:
- The limits on full diagnosis are exceeded. LeanSentry limits how often the full hang diagnosis is performed. By default, it will only perform the full diagnosis 3 times an hour per application pool, and 20 times a day total per server. If you would like to adjust this frequency, please email support.
- There is already a debugger attached to the worker process.
- An error occurs while performing the analysis.
3. Hang diagnosis reports error.
You may see errors on servers where the hang diagnostic is enabled, indicating a failure to perform the hang diagnostic. This warning will also typically indicate the cause of the error. If you are unable to resolve the error yourself and need assistance, please contact support.


Comments
0 comments
Article is closed for comments.